Inflation vs Disinflation – Rising Prices vs Slower Price IncreasesSL
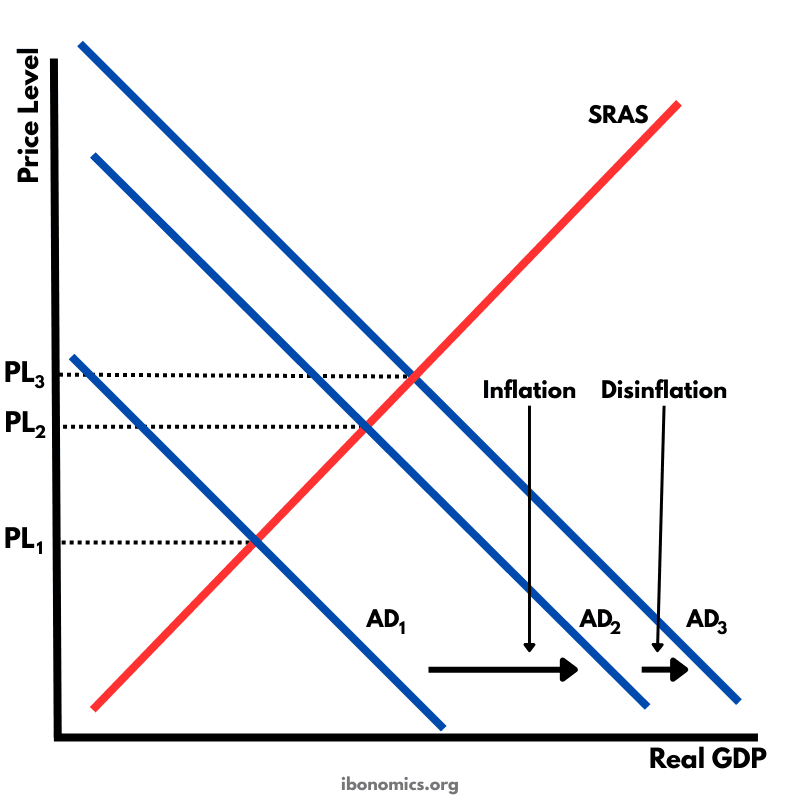
MacroeconomicsThis diagram uses the AD and SRAS model to show the difference between inflation and disinflation. Inflation is shown when aggregate demand increases from AD1 to AD2, causing the equilibrium price level to rise from PL1 to PL2. Disinflation is shown when aggregate demand continues to increase from AD2 to AD3, but by a smaller amount than before, so the price level still rises from PL2 to PL3 but at a slower rate. Therefore, during disinflation the price level is still increasing, but the rate of inflation is falling.
Curves and elements
- ad1
- AD1: Initial aggregate demand curve where equilibrium is at PL1.
- ad2
- AD2: Aggregate demand after a larger increase in demand, creating inflation as the price level rises to PL2.
- ad3
- AD3: Aggregate demand after a smaller further increase in demand, creating disinflation as the price level rises to PL3 but more slowly.
- sras
- SRAS: Short-run aggregate supply curve. With SRAS unchanged, shifts in AD change both the price level and real GDP.
Key explanations
- 1
Starting at AD1, the economy is initially in equilibrium at price level PL1 where AD1 intersects SRAS.
- 2
When aggregate demand increases to AD2, equilibrium moves up SRAS and the price level rises from PL1 to PL2. This is inflation because the general price level is rising.
- 3
Aggregate demand increases again from AD2 to AD3, but the shift is smaller than the previous increase in AD.
- 4
Because the second AD increase is smaller, the price level still rises from PL2 to PL3, but by a smaller amount than before. This is disinflation.
- 5
Disinflation does not mean prices are falling. It means prices are rising more slowly, so the inflation rate is decreasing.
Example exam question
Using the diagram, explain how disinflation can occur even though the price level is still rising.
Show example answer
Disinflation occurs when the inflation rate falls, meaning the price level is still rising but by a smaller amount than before. In the diagram, the first increase in aggregate demand from AD1 to AD2 raises the price level from PL1 to PL2, which is inflation. Aggregate demand then increases again from AD2 to AD3, but by less than the earlier shift, so the price level rises from PL2 to PL3 more slowly. Prices are still increasing, but the rate of increase is lower, which is disinflation.