Monopolistic Competition – Long-Run Equilibrium (Normal Profit)HL
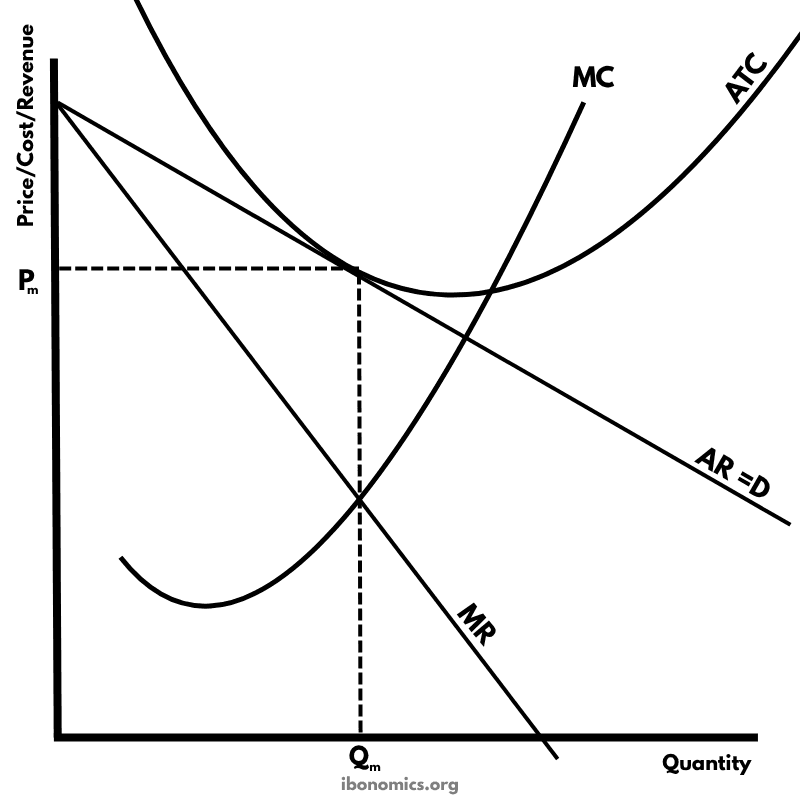
MicroeconomicsA diagram illustrating a firm in monopolistic competition in long-run equilibrium, where it earns normal profit. The ATC curve is tangent to the demand curve (AR), meaning total revenue equals total cost.
Curves and elements
- ar
- AR = D: The average revenue or demand curve, downward sloping due to product differentiation.
- mr
- MR: Marginal Revenue, lies below AR because the firm must lower price to sell more.
- mc
- MC: Marginal Cost, intersects MR at the profit-maximizing output Qm.
- atc
- ATC: Average Total Cost, tangent to AR at Qm, indicating zero economic profit.
- q
- Qm: The output level where MR = MC.
- p
- Pm: The price corresponding to Qm on the AR curve.
Key explanations
- 1
Firms in monopolistic competition face a downward-sloping demand curve (AR = D) due to product differentiation.
- 2
The profit-maximizing quantity is found where marginal cost (MC) equals marginal revenue (MR).
- 3
The corresponding price (Pm) is determined by extending a line from Qm up to the AR curve.
- 4
In the long run, the ATC curve is tangent to the AR curve at Qm, indicating that the firm earns normal profit (no economic profit).
- 5
This outcome results from the entry of new firms eroding any abnormal profits that existed in the short run.
Example exam question
Using a diagram, explain why a firm in monopolistic competition earns only normal profit in the long run.
Show example answer
In the long run, the entry of new firms in monopolistic competition shifts the demand curve leftward until it becomes tangent to the ATC curve at the point where MC = MR. This tangency means the firm’s total revenue equals total cost, so it earns only normal profit. This is the long-run equilibrium outcome due to low barriers to entry.