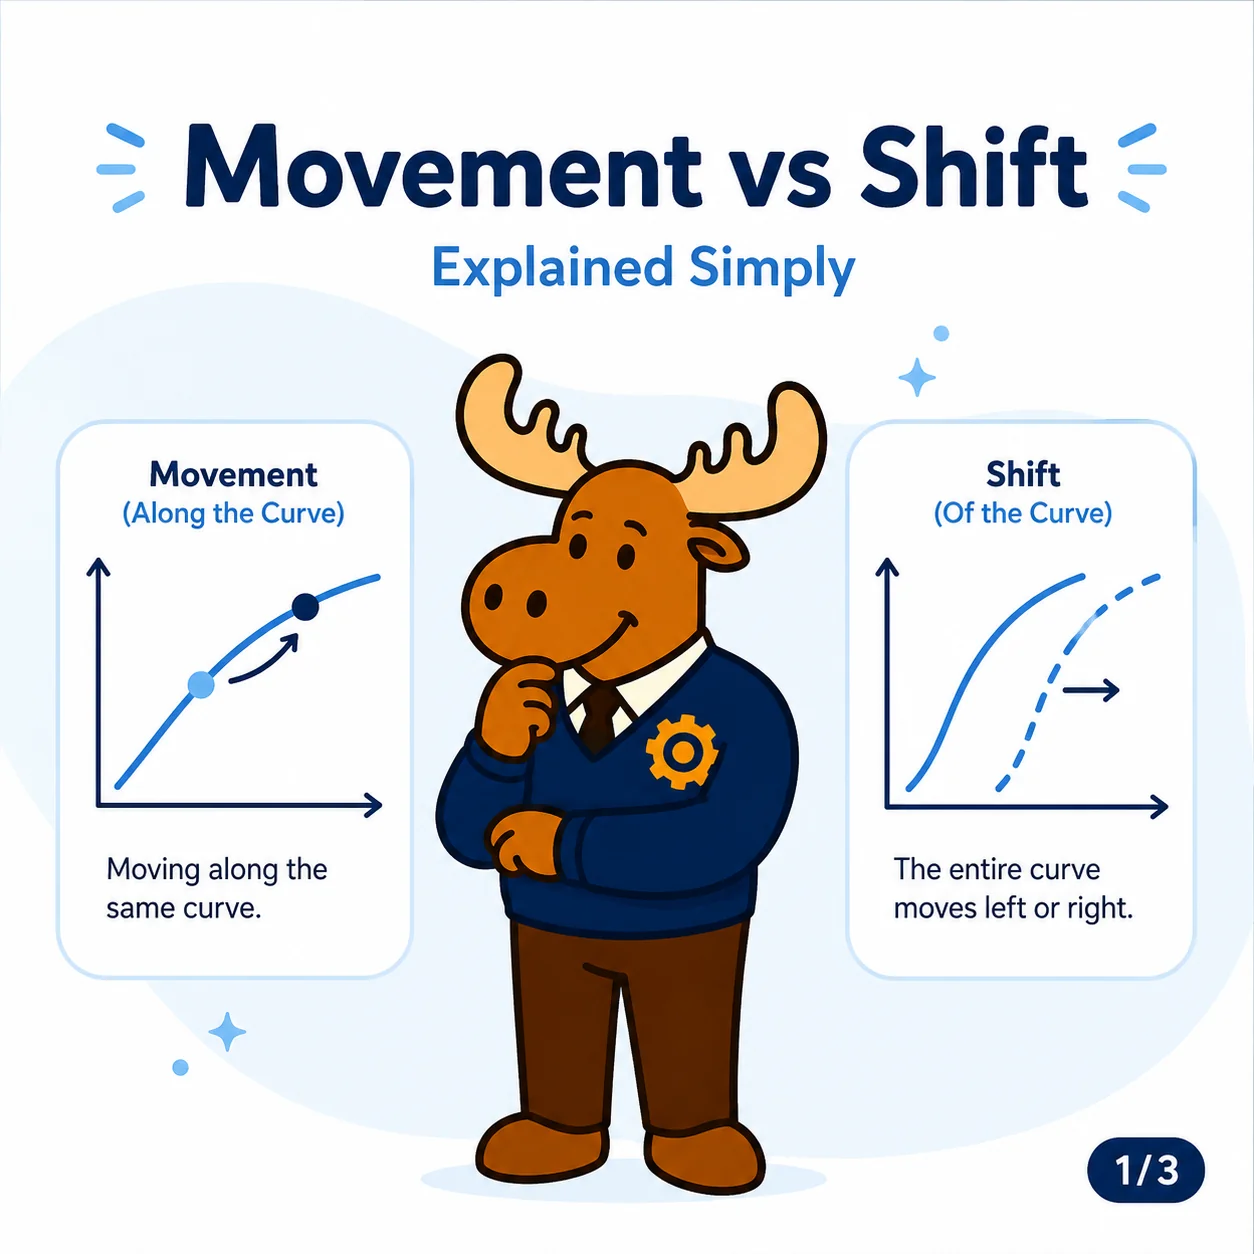
Shifting Demand and Supply Curves
Competitive Market Equilibrium
Syllabus requirement
How changes in demand or supply cause a new equilibrium, with reference to excess demand (shortage) and excess supply (surplus).
Summary
This topic explains how market equilibrium is found where quantity demanded equals quantity supplied and how non-price factors shift demand or supply curves. Shifts change the equilibrium price and quantity and can create disequilibrium—either excess supply (surplus) or excess demand (shortage)—which market prices tend to eliminate through movements along curves. Diagrams showing curve shifts and the resulting changes in equilibrium are required to illustrate these effects. Understanding these shifts is essential for explaining real market price and quantity changes.