Demand Curve
Demand
AO4·Diagram required
Syllabus requirement
Graphical representation of the law of demand with downward slope.
Assessment objectives
AO4 Use of Appropriate Skills
Required diagram: Downward-sloping demand curve
Summary
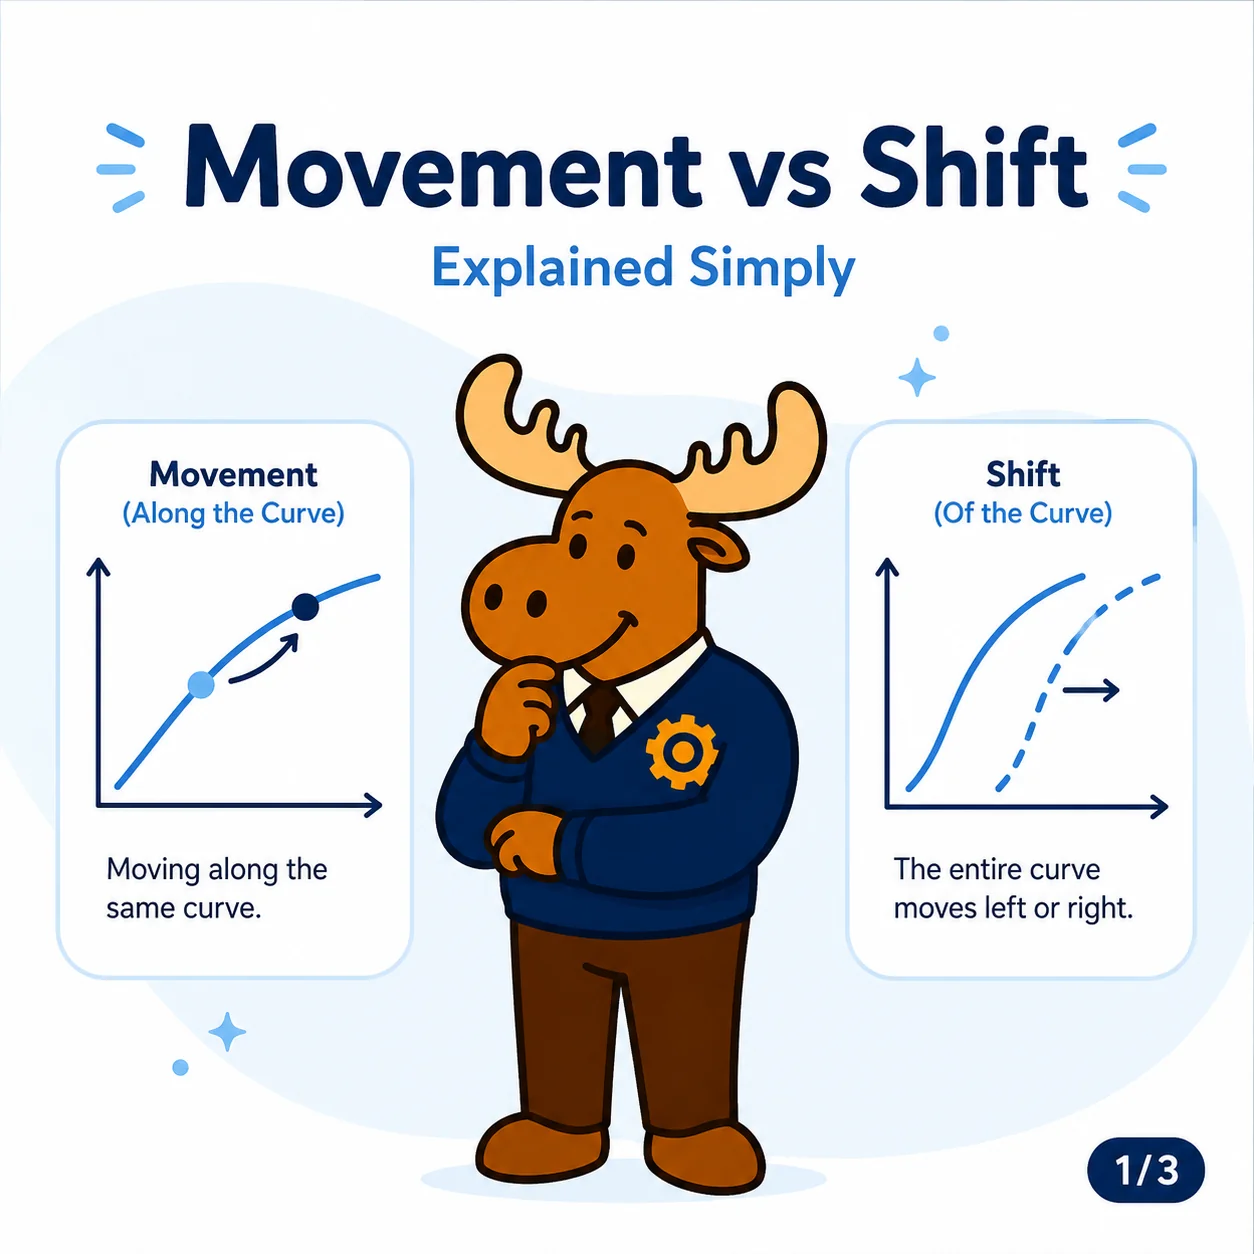
The demand curve shows the inverse relationship between the price of a product and the quantity demanded over a given time period. It plots price on the vertical axis and quantity demanded on the horizontal axis and is normally drawn as a linear downward-sloping line. Understanding the demand curve is essential for analysing how changes in price (ceteris paribus) cause movements along the curve versus shifts of the whole demand curve.