IBonomics
Unitary Price Elasticity of Supply – Why Steepness Doesn't Determine PESSL
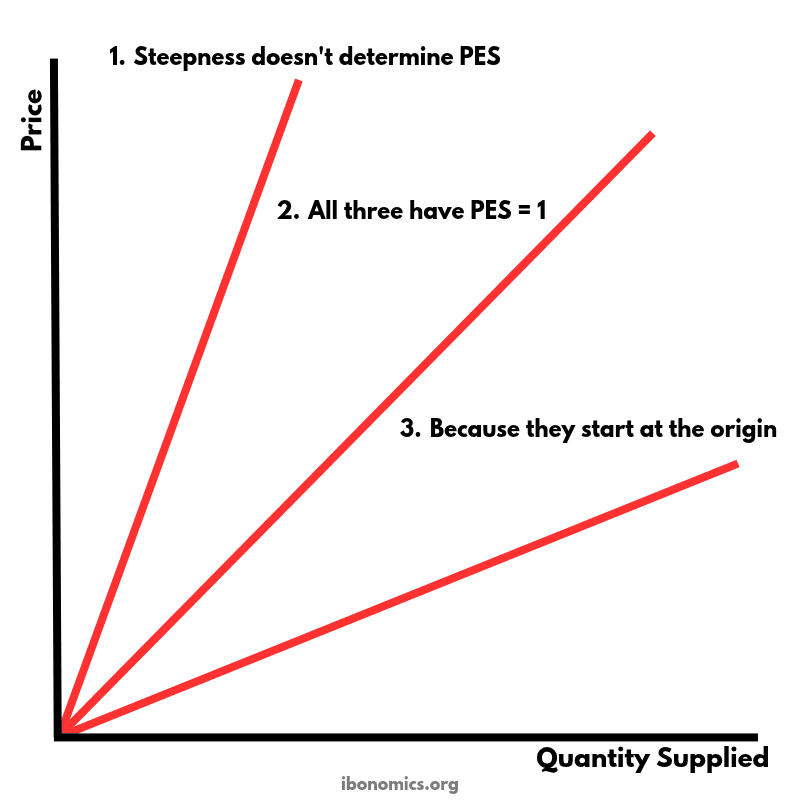
MicroeconomicsThis diagram shows three straight supply curves that all start at the origin. They have very different slopes, yet each one has a price elasticity of supply (PES) equal to 1. It shows that the PES of a straight supply curve depends on where the curve starts, not on how steep it is.
Curves and elements
- Steep line
- The steepest of the three supply curves. Quantity supplied rises by few units for each rise in price, but it starts at the origin, so PES = 1.
- Middle line
- A supply curve with a moderate slope. It also starts at the origin, so PES = 1.
- Flat line
- The flattest of the three supply curves. Quantity supplied rises by many units for each rise in price, but it starts at the origin, so PES = 1.
- Origin
- The point where price and quantity supplied are both zero. All three curves start here, which is what makes each of them unitary.
Key explanations
- 1
Price elasticity of supply (PES) measures how much quantity supplied responds to a change in price, in percentage terms. PES equals 1 when the percentage change in quantity supplied equals the percentage change in price.
- 2
A straight line that starts at the origin keeps price and quantity supplied in a fixed ratio. If price doubles, quantity supplied doubles as well, so the two always change by the same percentage.
- 3
This holds whatever the slope. The steep line and the flat line show very different quantities at each price, but on both of them a 10% rise in price brings a 10% rise in quantity supplied.
- 4
Slope and elasticity measure different things. Slope compares the absolute changes in price and quantity, while elasticity compares their percentage changes.
- 5
A straight supply curve that doesn't start at the origin has a different PES. If it cuts the price axis, PES is greater than 1, and if it cuts the quantity axis, PES is less than 1.
Example exam question
Using a diagram, explain why two straight supply curves with different slopes can have the same price elasticity of supply.
Show example answer
A straight supply curve that starts at the origin has a PES of 1 at every point, because price and quantity supplied stay in a fixed ratio. If price rises by 10%, quantity supplied also rises by 10%. In the diagram all three lines start at the origin, so all three have a PES of 1, even though one is steep and another is flat. This shows that PES depends on percentage changes and not on the slope of the curve. A straight supply curve that cuts the price axis instead has a PES above 1, and one that cuts the quantity axis has a PES below 1.