IBonomics
Business Objectives – Profit, Revenue and Sales Maximisation
This diagram shows how a firm's output and price depend on its objective. A profit-maximising firm produces Q1, where MR = MC. A revenue-maximising firm produces more, at Q2, where MR = 0. A sales-maximising firm produces the most, at Q3, where AR = AC and it makes only normal profit.
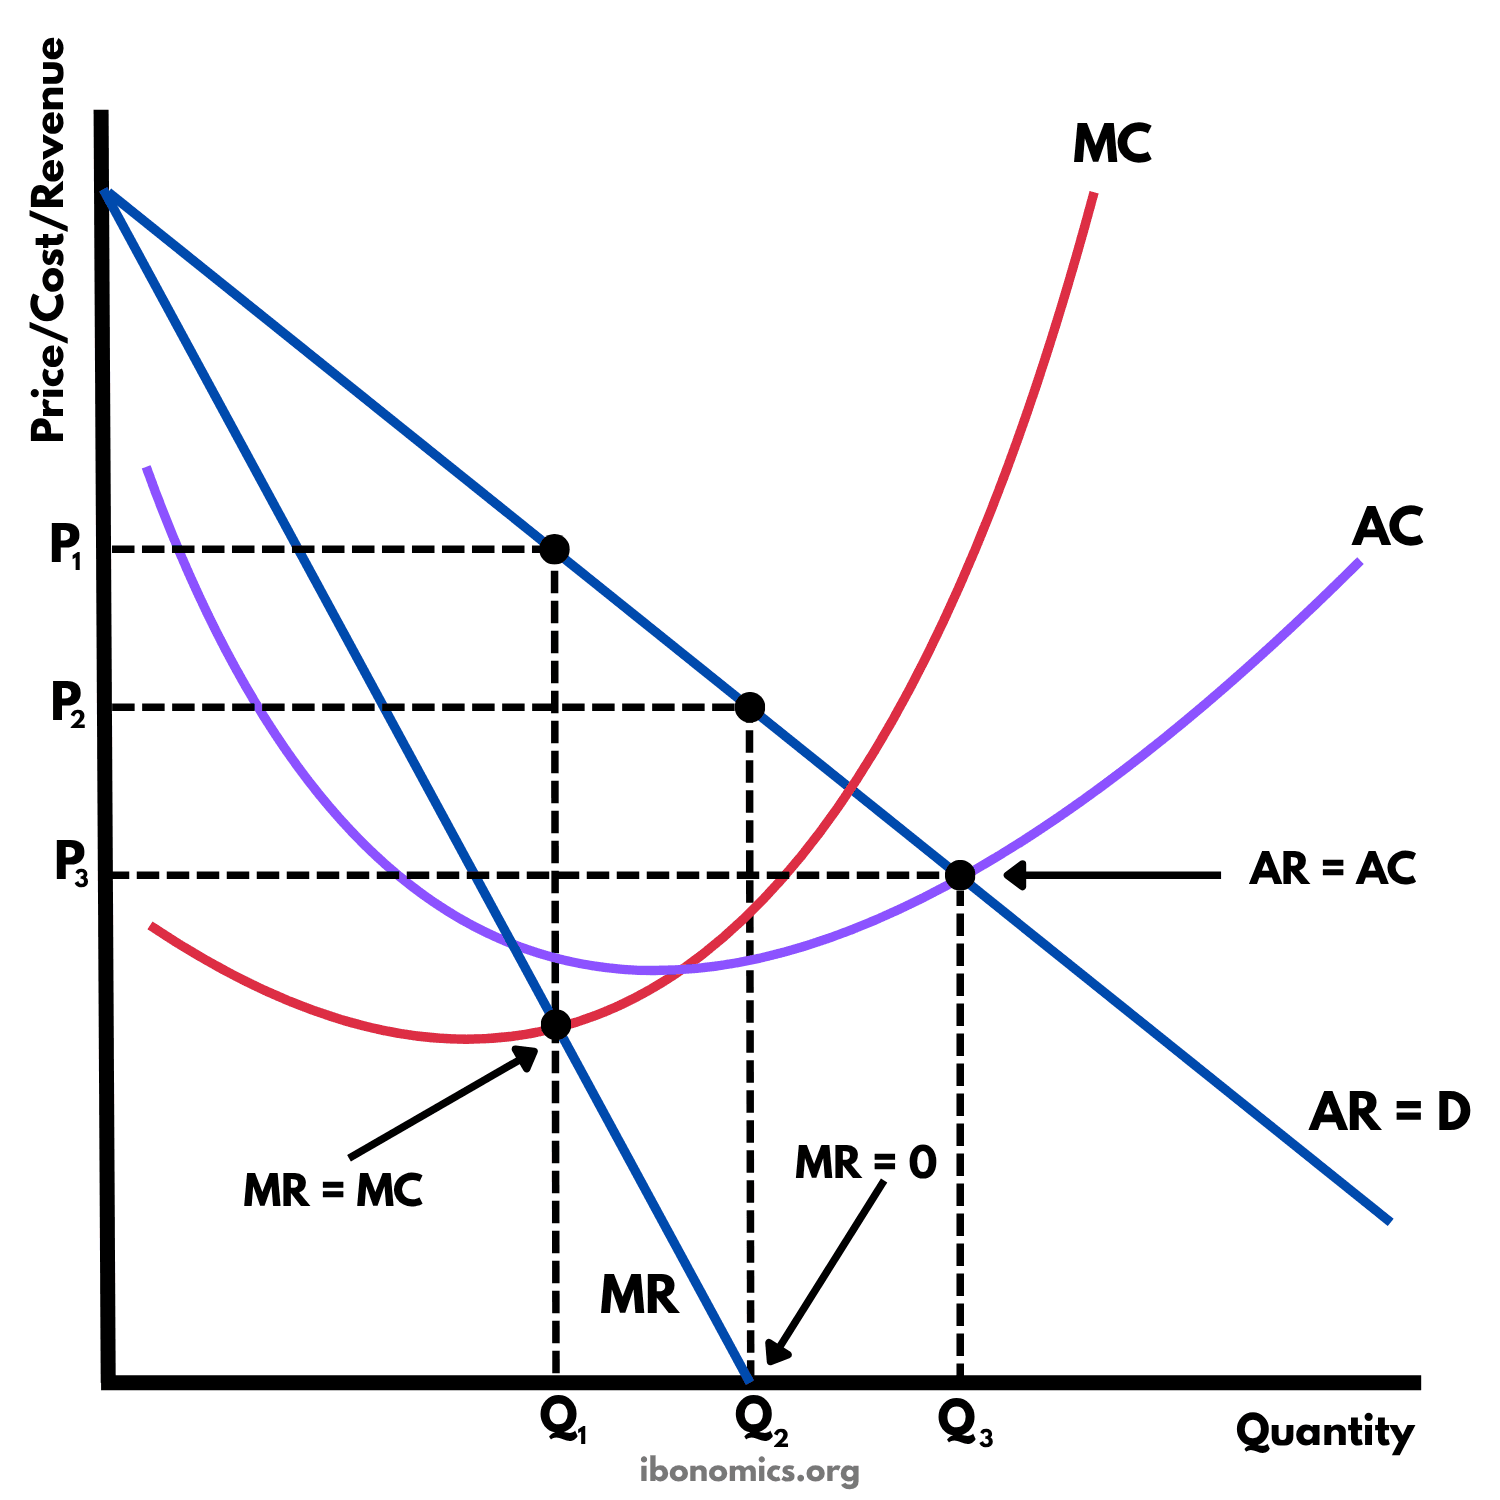
Curves and elements
- MC
- Marginal cost, the extra cost of producing one more unit. It cuts AC at its lowest point.
- AC
- Average cost, total cost divided by output. It is U-shaped.
- AR = D
- Average revenue, which is the demand curve. It slopes downward, so the firm must lower its price to sell more.
- MR
- Marginal revenue, the extra revenue from selling one more unit. It lies below AR, because selling one more unit means cutting the price on every unit, and it reaches zero at Q2.
- MR = MC
- The profit-maximising rule. At Q1 the last unit adds as much to revenue as to cost, so profit cannot be raised any further.
- MR = 0
- The point where one more unit adds nothing to total revenue, so total revenue is highest, at Q2.
- AR = AC
- The point where the price just covers average cost, so the firm makes normal profit. Q3 is the largest output the firm can sell without making a loss.
- P1
- The price a profit-maximising firm charges, the highest of the three.
- P2
- The price a revenue-maximising firm charges.
- P3
- The price a sales-maximising firm charges, the lowest of the three, equal to average cost.
- Q1
- The profit-maximising output, where MR = MC.
- Q2
- The revenue-maximising output, where MR = 0.
- Q3
- The sales-maximising output, where AR = AC.
Key explanations
- 1
The firm faces a downward-sloping demand curve, AR = D, so it must lower its price to sell more. Its marginal revenue, MR, is below AR, because selling one more unit means cutting the price on every unit it sells.
- 2
Profit maximisation is the traditional objective. The firm produces Q1, where MR = MC, and charges P1. Beyond Q1, each extra unit would add more to cost than to revenue, so profit is highest here. P1 is above AC at Q1, so the firm makes abnormal profit.
- 3
Revenue maximisation means making total revenue as large as possible, for example when managers are rewarded for sales revenue. Total revenue rises as long as MR is positive, so it is highest at Q2, where MR = 0, at the lower price P2. For a straight-line demand curve, MR is twice as steep as AR, so MR = 0 halfway along the demand curve, where PED = 1.
- 4
Sales maximisation means selling as many units as possible without making a loss. The firm can keep expanding until the price just covers average cost, at Q3, where AR = AC. It charges P3 and makes only normal profit. A firm may do this to grow or to win market share.
- 5
The three objectives fall in a clear order. Profit maximisation gives the lowest output and the highest price, sales maximisation the highest output and the lowest price, and revenue maximisation lies between them.
- 6
Firms can have other objectives too, such as satisficing, where managers aim for a satisfactory profit rather than the highest, or corporate social responsibility.
Example exam question
Using a diagram, explain how a firm's price and output differ if it aims to maximise profit, revenue or sales.
Show example answer
A firm with a downward-sloping demand curve (AR = D) has marginal revenue (MR) below AR. If it maximises profit, it produces Q1, where MR = MC, because any extra unit would add more to cost than to revenue. It charges P1, the highest of the three prices, and makes abnormal profit, as P1 is above AC. If it maximises revenue, it produces where MR = 0, at Q2, because total revenue rises as long as MR is positive. Output is higher and the price lower, at P2. If it maximises sales, it produces as much as it can without making a loss, where AR = AC, at Q3. Output is highest and the price lowest, at P3, and the firm makes only normal profit. So the further the firm moves from profit maximisation, the more it produces and the lower its price.