IBonomics
Diminishing Marginal Utility – How Total and Marginal Utility Change with Consumption
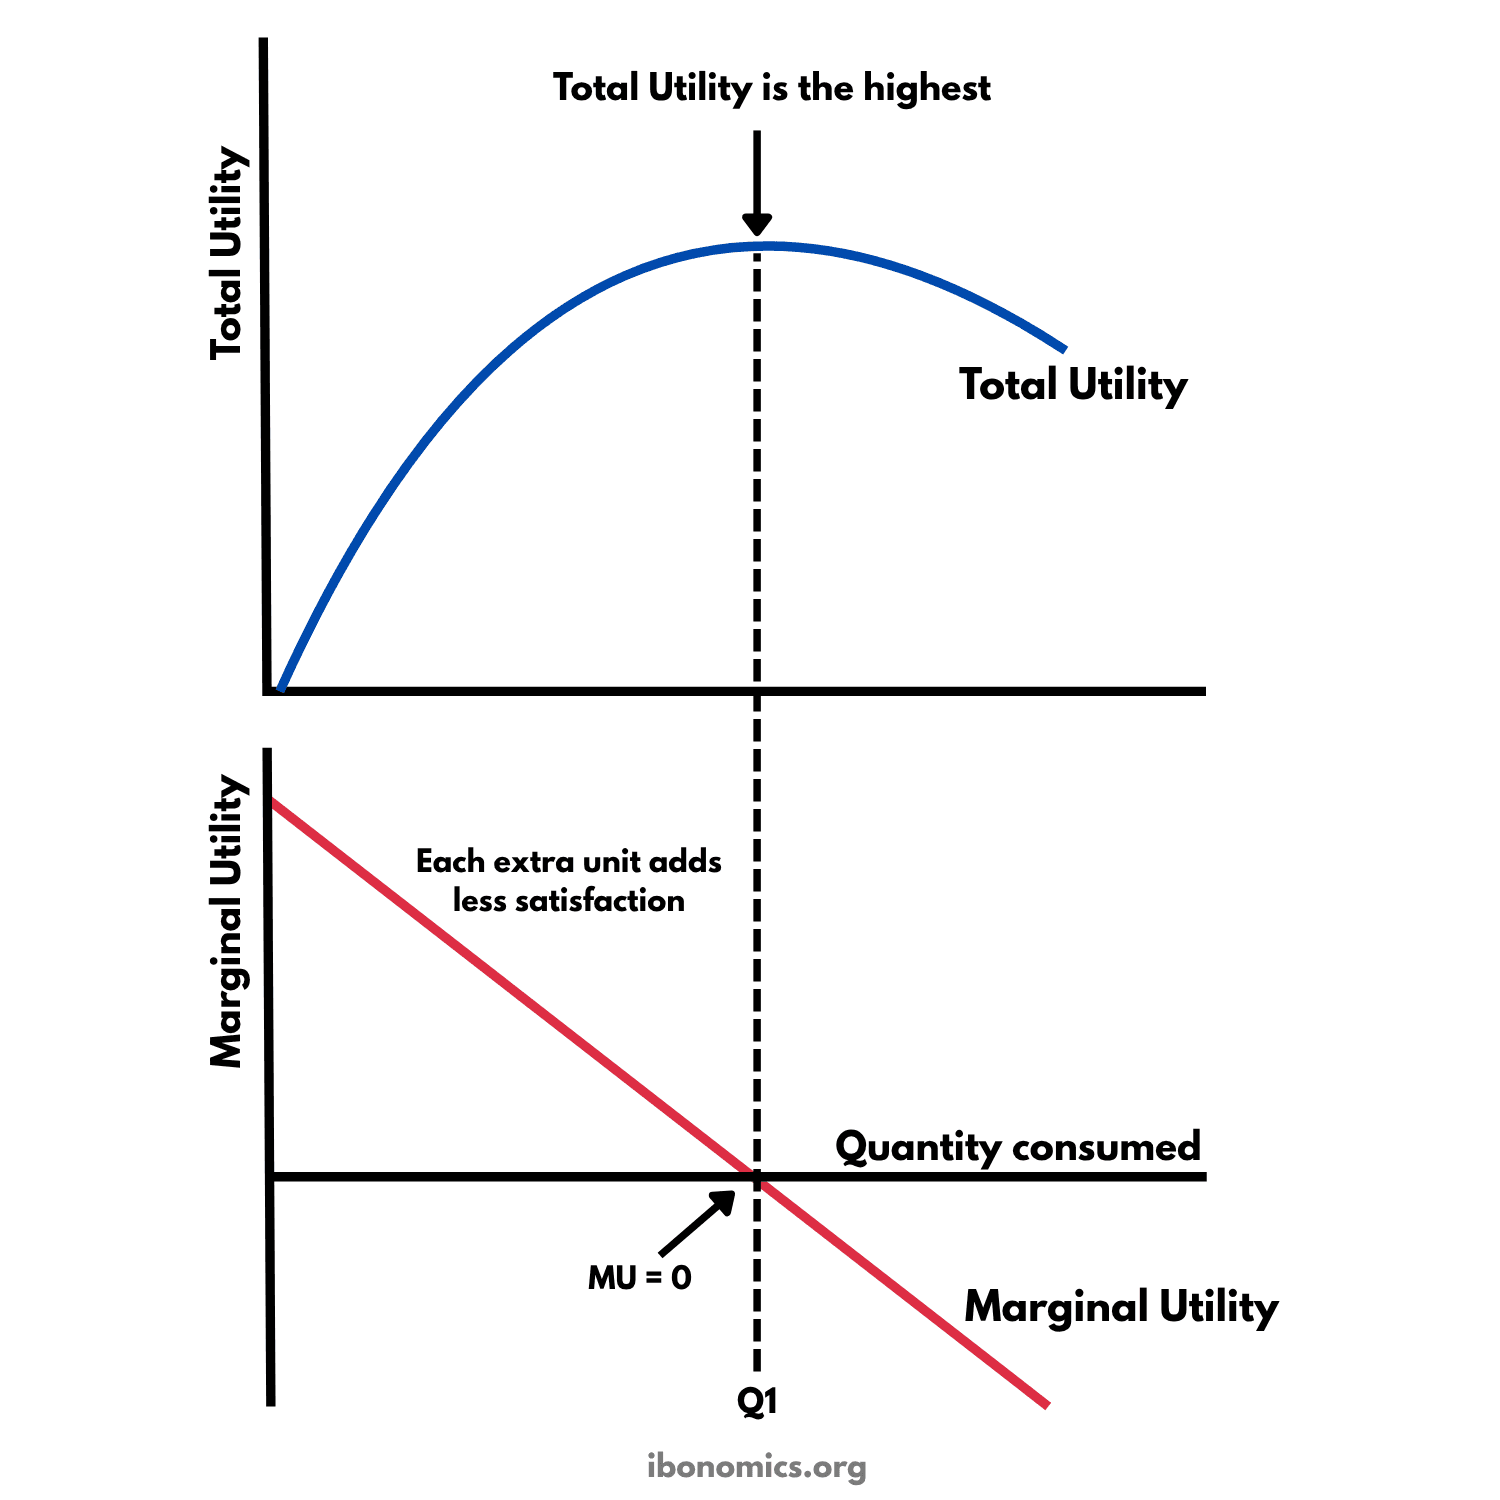
This diagram shows the law of diminishing marginal utility. As a consumer has more of a good in a given period, each extra unit adds less satisfaction than the one before, so marginal utility falls. Total utility rises while marginal utility is positive, is highest at Q1, where marginal utility is zero, and falls after that.
Curves and elements
- Total Utility is the highest
- The peak of the total utility curve, at Q1. One more unit would add nothing, so total utility cannot rise any further.
- Total Utility
- The satisfaction from all the units consumed. It rises at a slower and slower rate, peaks at Q1 and then falls.
- Each extra unit adds less satisfaction
- Marginal utility falls as consumption rises. This is the law of diminishing marginal utility.
- Marginal Utility
- The extra satisfaction from consuming one more unit. It slopes downward, reaches zero at Q1 and is negative beyond it.
- MU = 0
- The point where one more unit adds no satisfaction at all. It is at the same quantity, Q1, as the highest point of total utility.
- Q1
- The quantity at which marginal utility is zero and total utility is highest.
Key explanations
- 1
Utility is the satisfaction a consumer gets from consuming a good. Total utility is the satisfaction from all the units consumed, and marginal utility is the extra satisfaction from one more unit.
- 2
The law of diminishing marginal utility says that, as a consumer has more of a good in a given period, each extra unit adds less satisfaction than the one before. The first slice of pizza adds a lot of satisfaction, and the fourth much less, so the marginal utility line slopes downward.
- 3
While marginal utility is positive, each extra unit still adds some satisfaction, so total utility keeps rising. It rises by less each time, so the total utility curve gets flatter.
- 4
At Q1, marginal utility is zero, so one more unit adds nothing and total utility is at its highest. Beyond Q1, marginal utility is negative. Each extra unit makes the consumer worse off, so total utility falls.
- 5
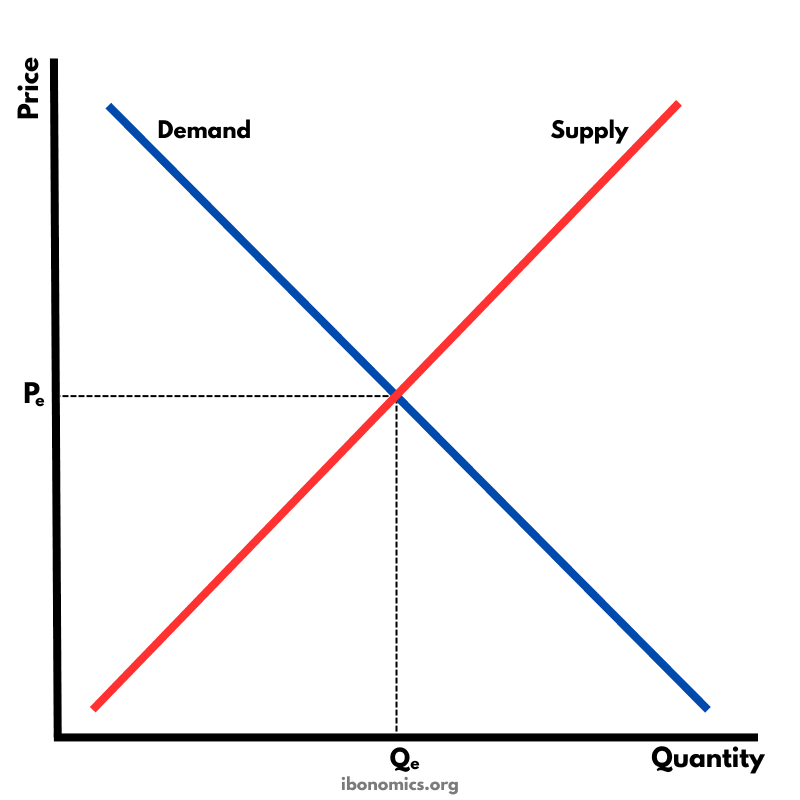
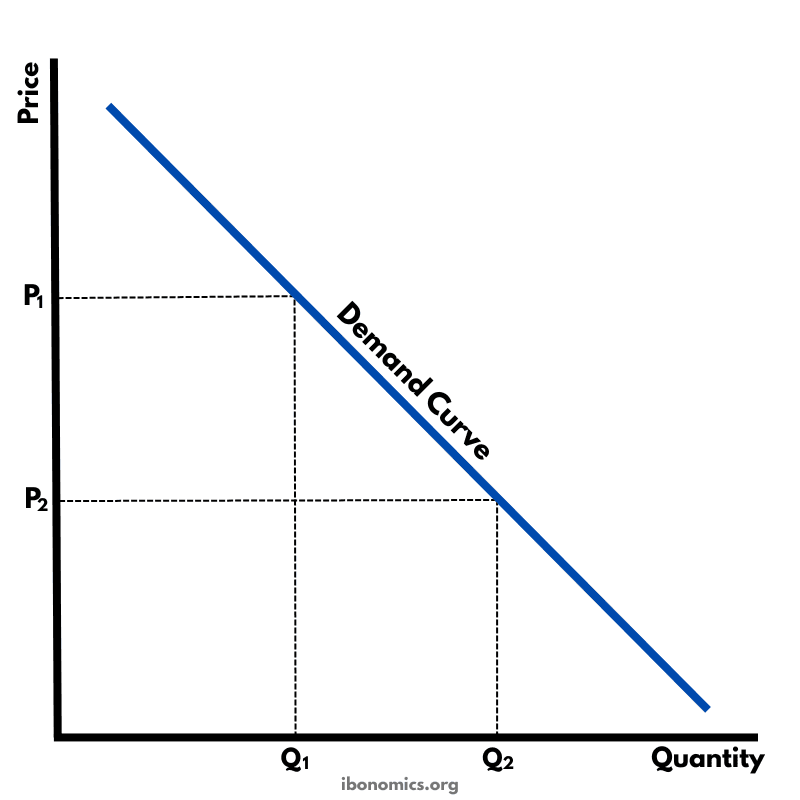
This assumption helps explain the law of demand. Each extra unit is worth less to the consumer than the one before, so they will buy more only if the price falls. That is why the quantity demanded rises as the price falls, and the demand curve slopes downward.
Example exam question
Explain how the law of diminishing marginal utility helps explain why the demand curve slopes downward.
Show example answer
Marginal utility is the extra satisfaction a consumer gets from consuming one more unit of a good. The law of diminishing marginal utility states that, in a given period, each extra unit consumed adds less satisfaction than the one before. In the diagram, marginal utility falls as consumption rises, so total utility rises by less with each unit until it reaches its highest point at Q1, where marginal utility is zero. Because each extra unit gives less satisfaction, the consumer values it less and is willing to pay less for it. To persuade the consumer to buy more units, the price must fall. This is why the quantity demanded rises as the price falls, and the demand curve slopes downward.