IBonomics
Short-Run Cost Curves – How Diminishing Marginal Returns Shape MC, AVC and ATC
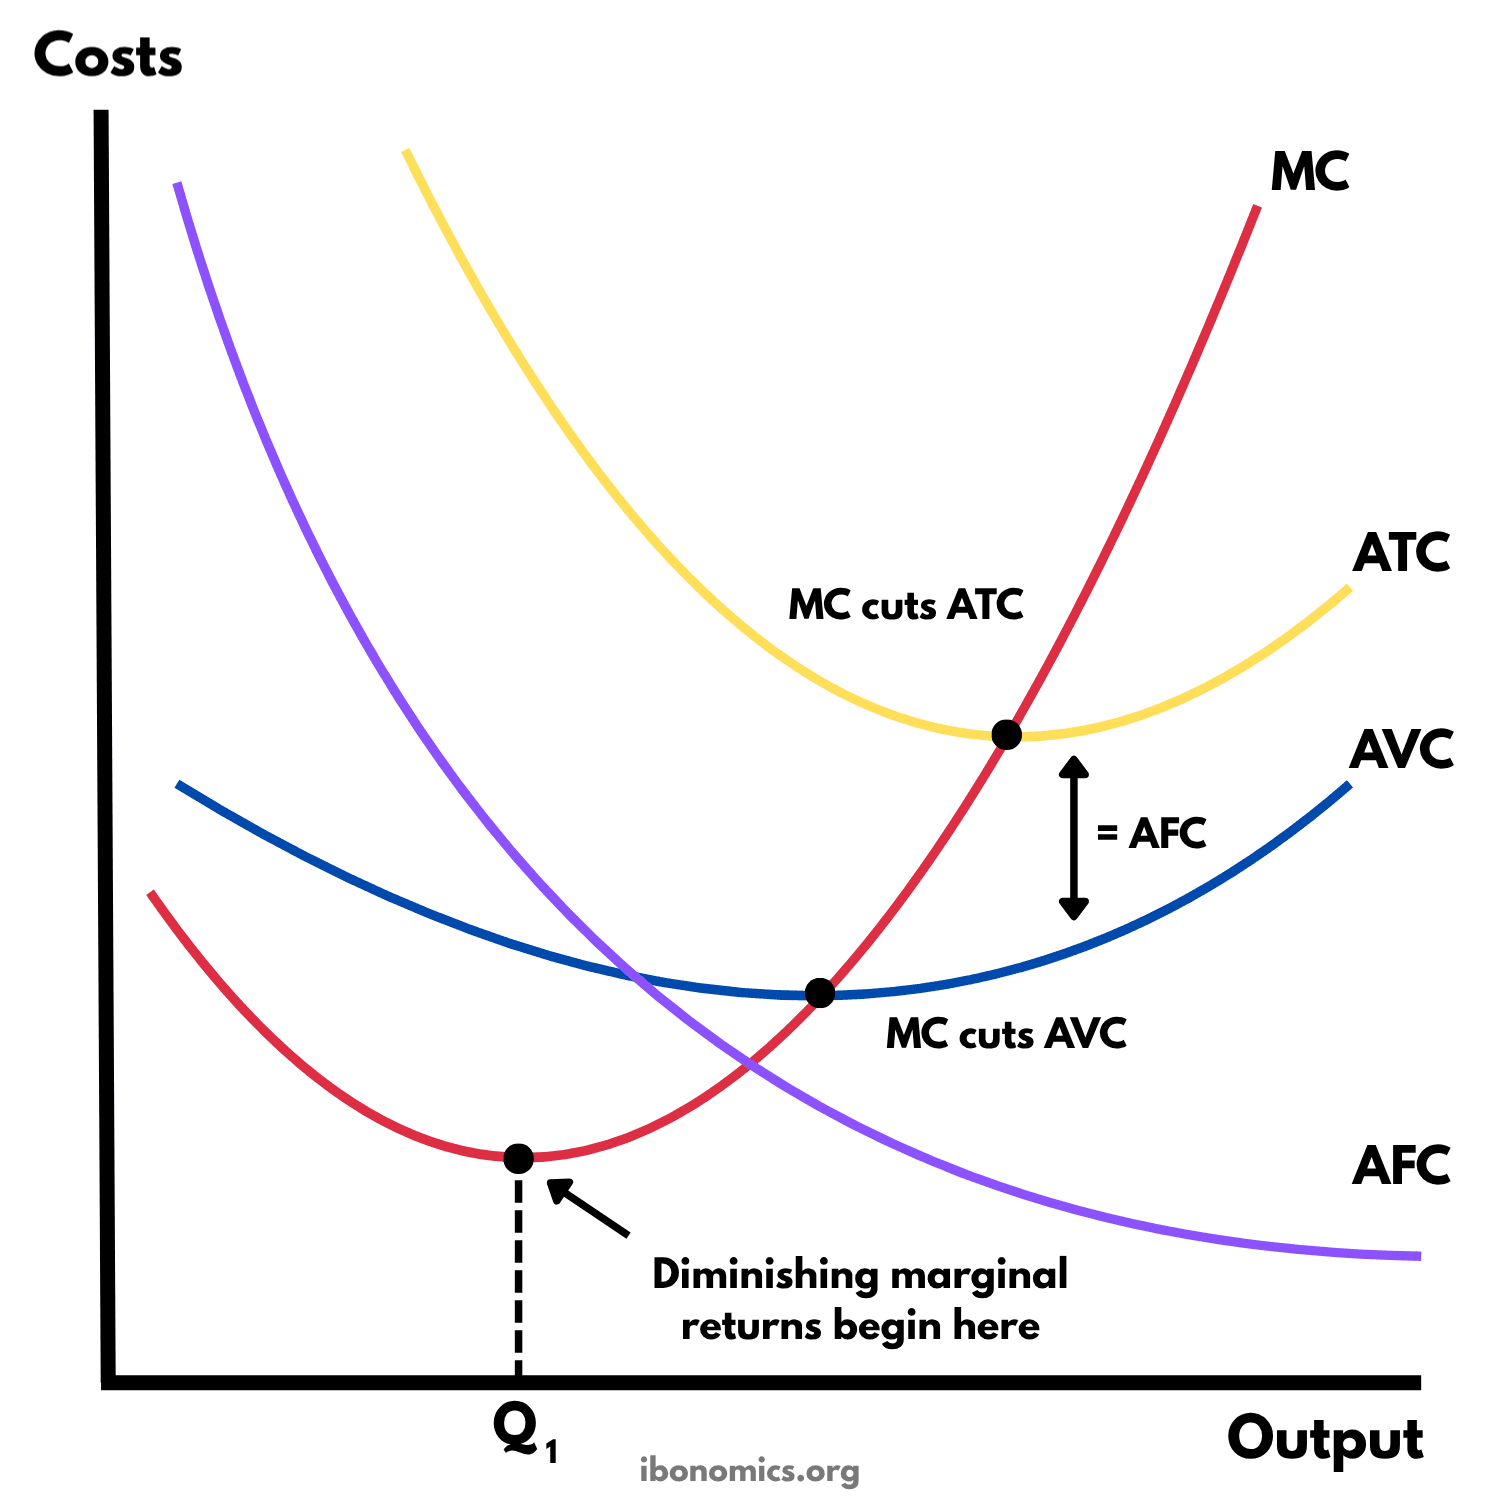
This diagram shows a firm's short-run cost curves and how the law of diminishing marginal returns shapes them. Marginal cost falls at first, then rises once diminishing marginal returns set in at Q1. MC cuts average variable cost and average total cost at their lowest points, and the gap between them is average fixed cost.
Curves and elements
- MC
- Marginal cost, the extra cost of producing one more unit. It falls at first, then rises from Q1 once diminishing marginal returns set in.
- ATC
- Average total cost, total cost divided by output. It is U-shaped, and lowest where MC cuts it.
- AVC
- Average variable cost, variable cost divided by output. It is U-shaped too, and lowest where MC cuts it, at a smaller output than the lowest point of ATC.
- AFC
- Average fixed cost, fixed cost divided by output. It falls continuously as output rises, because the same fixed cost is spread over more units.
- MC cuts ATC
- MC passes through the lowest point of ATC, the output at which cost per unit is lowest.
- = AFC
- The vertical gap between ATC and AVC. Average total cost is average variable cost plus average fixed cost, so the gap is AFC, and it narrows as output rises.
- MC cuts AVC
- MC passes through the lowest point of AVC. While MC is below AVC it pulls the average down, and once it is above it pulls the average up.
- Diminishing marginal returns begin here
- The lowest point of MC, at Q1. Beyond it, each extra worker adds less output than the one before, so each extra unit costs more to make.
- Q1
- The output at which MC is lowest and diminishing marginal returns begin.
Key explanations
- 1
In the short run, at least one factor of production, such as the firm's machinery or premises, is fixed. The firm can only raise output by adding variable factors, such as labour, to the fixed ones.
- 2
At first, each extra worker adds more output than the one before, because workers can specialise and make fuller use of the fixed capital. Each extra unit of output then costs less to make, so MC falls.
- 3
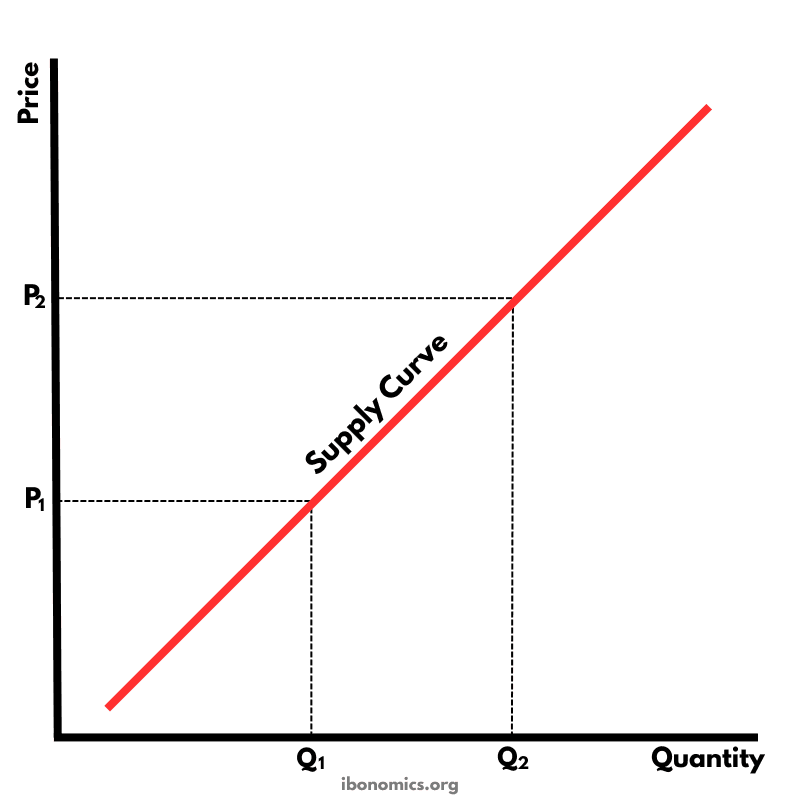
Beyond Q1, the law of diminishing marginal returns sets in. With the fixed factor shared among more workers, each extra worker adds less output than the one before, so each extra unit costs more to make and MC rises. Increasing marginal costs are why the supply curve slopes upward.
- 4
MC cuts AVC and ATC at their lowest points. When the cost of the next unit is below the average, it pulls the average down, and when it is above the average, it pulls the average up. So both averages fall while MC is below them and rise once MC is above them.
- 5
AFC falls continuously, because the firm's fixed cost is spread over more and more units. Since ATC = AVC + AFC, the gap between ATC and AVC is AFC, and it narrows as output rises.
- 6
These curves sit behind every market structure diagram. A firm maximises profit where MC = MR, and compares the price with ATC to see whether it makes abnormal profit, normal profit or a loss.
Example exam question
Using a diagram, explain how the law of diminishing marginal returns affects a firm's short-run marginal cost.
Show example answer
In the short run, at least one factor of production, such as capital, is fixed, so a firm raises output by adding variable factors such as labour. At first, each extra worker adds more output than the one before, because workers can specialise and use the fixed capital more fully, so marginal cost (MC) falls. Beyond Q1, diminishing marginal returns set in. Each extra worker has less of the fixed capital to work with and adds less output than the one before, so each extra unit costs more to produce and MC rises. Rising marginal cost means a firm needs a higher price before it will supply more, which explains the upward-sloping supply curve. MC cuts average variable cost and average total cost at their lowest points, because a marginal cost below the average pulls it down and one above the average pulls it up.