IBonomics
Excess Demand and Excess Supply – How the Price Mechanism Restores Equilibrium
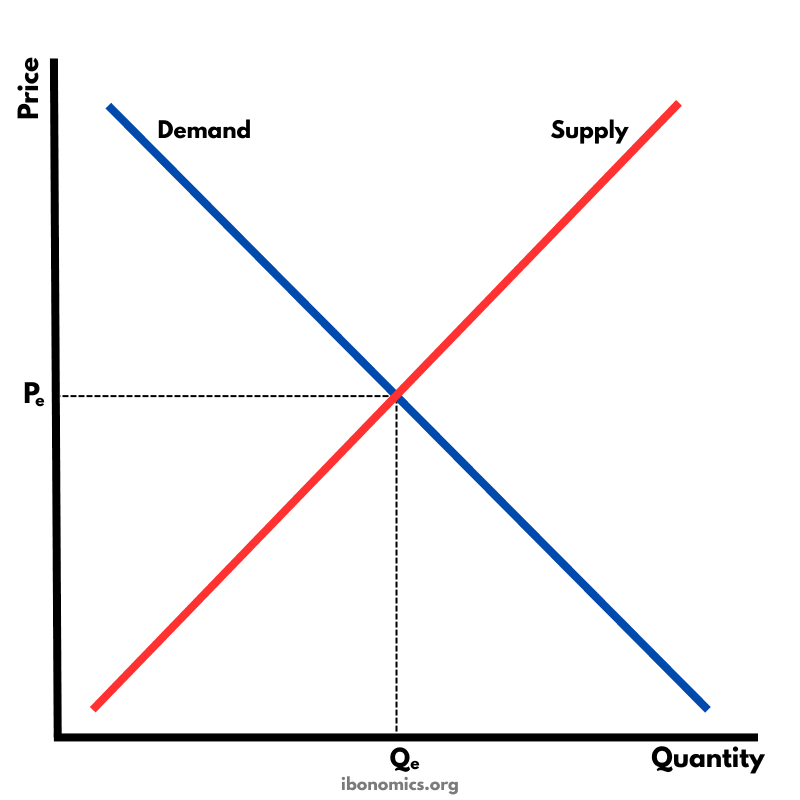
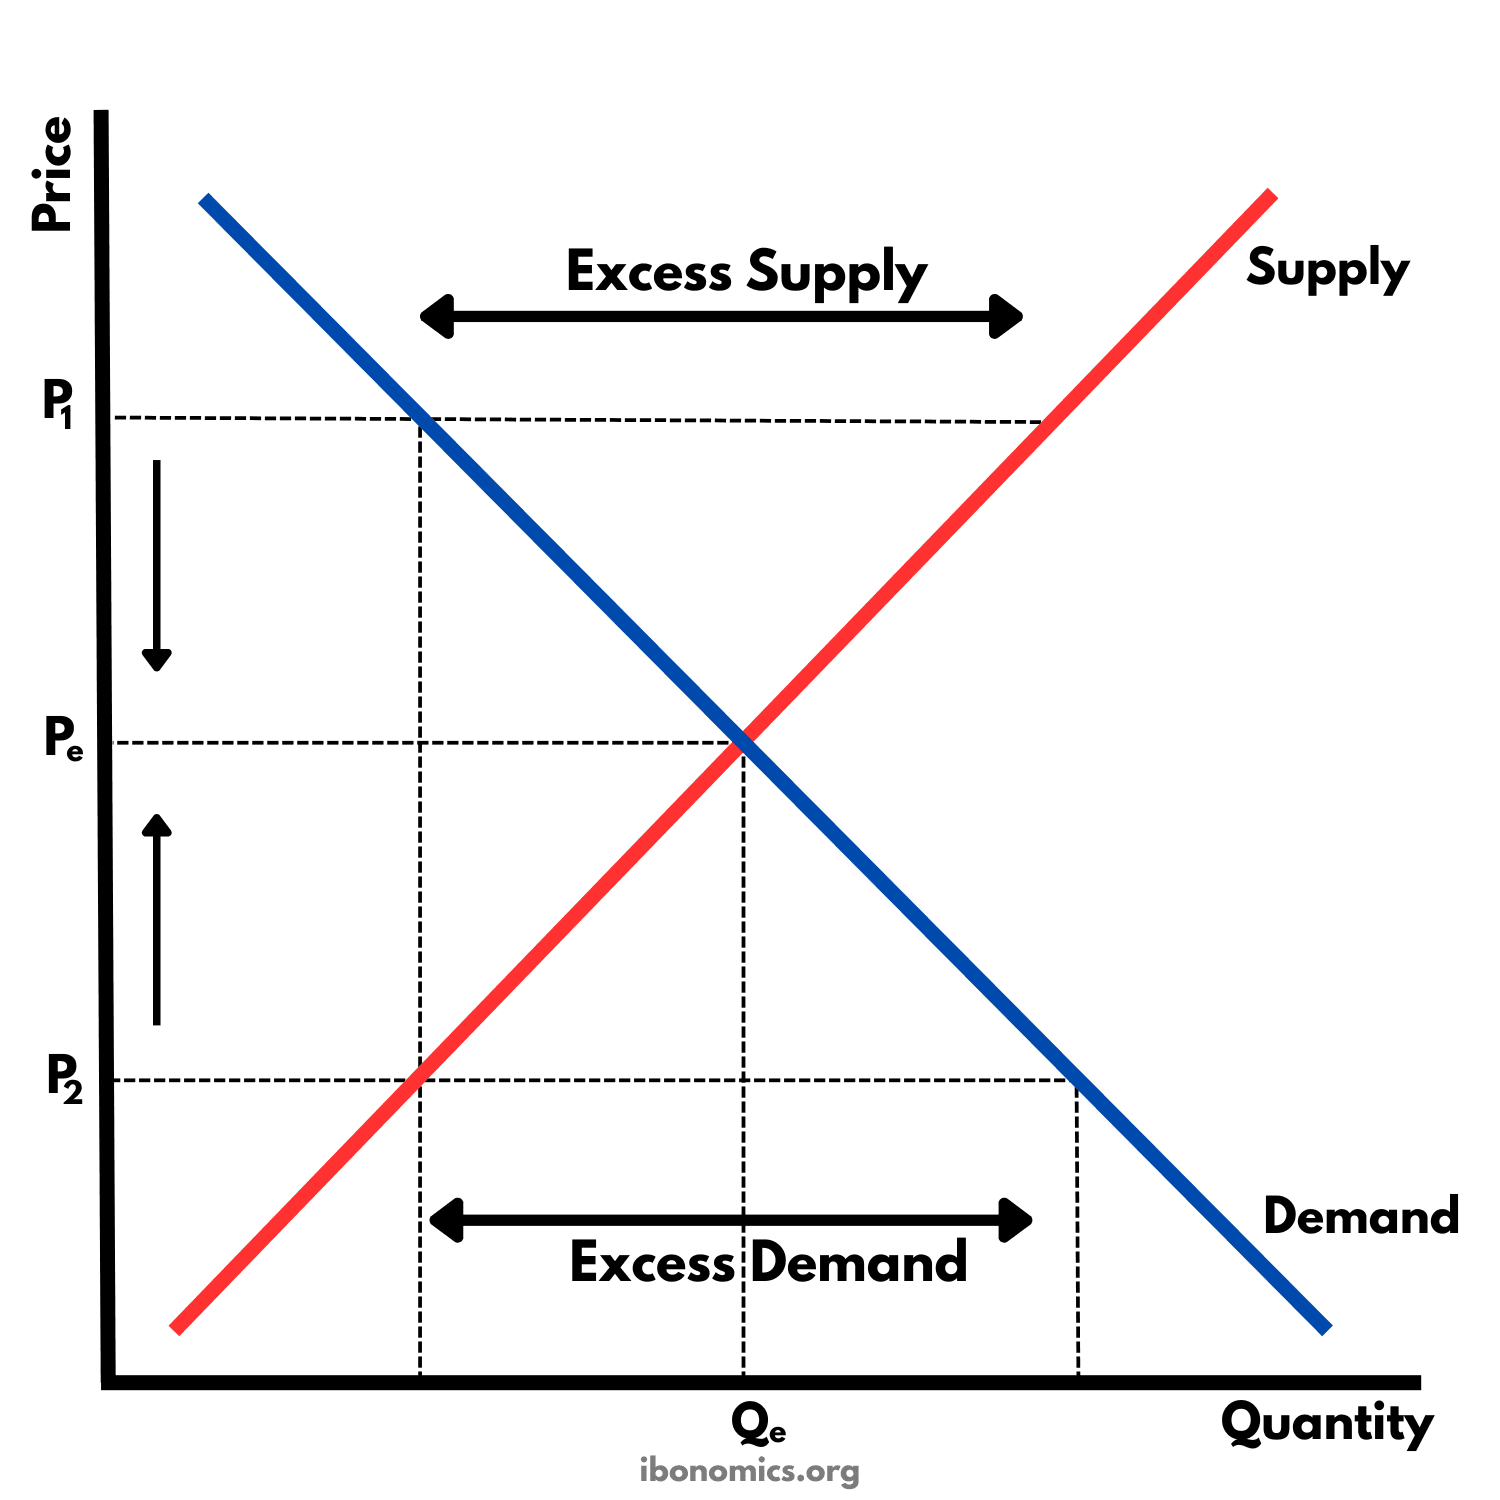
This diagram shows a market out of equilibrium. At a price above the equilibrium price there is excess supply, and at a price below it there is excess demand. In both cases the price moves back towards Pe, which shows how the price mechanism signals, gives incentives and rations.
Curves and elements
- Demand
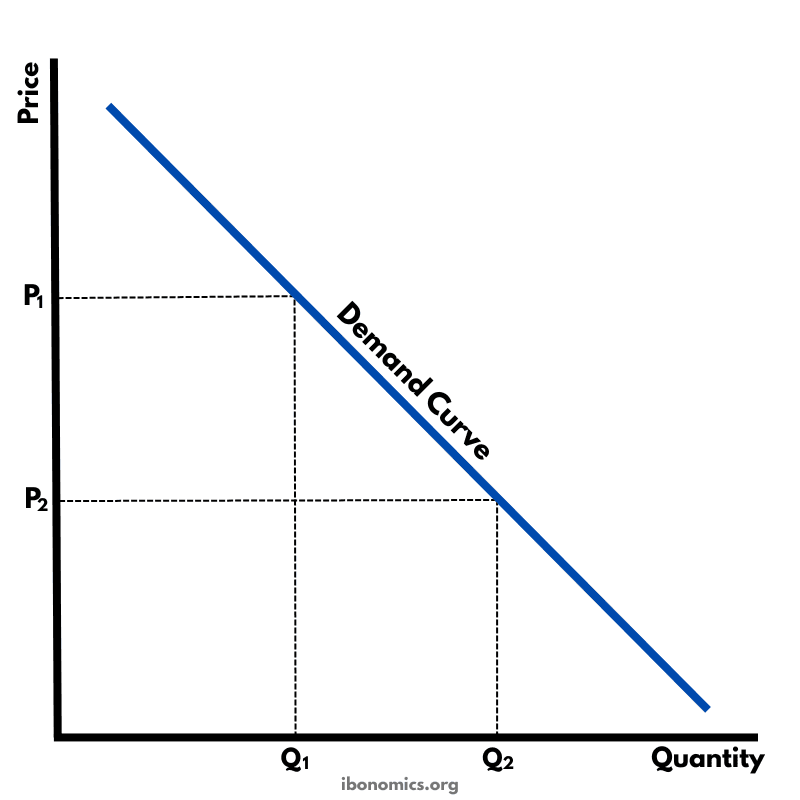
- Slopes downward. As the price falls, the quantity demanded rises.
- Supply
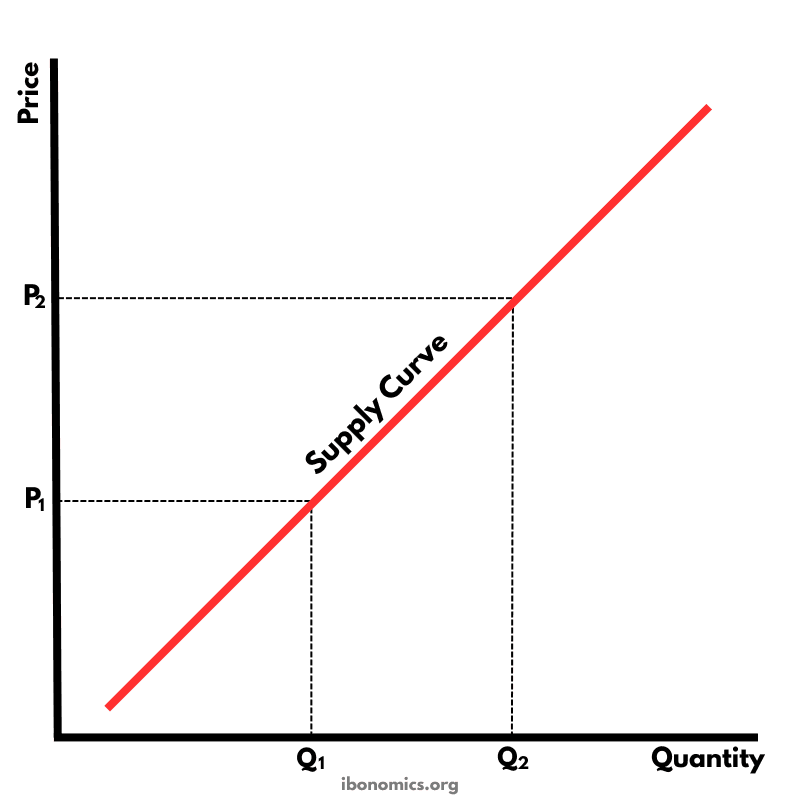
- Slopes upward. As the price rises, the quantity supplied rises.
- Pe
- The equilibrium price, where the quantity demanded equals the quantity supplied.
- Qe
- The equilibrium quantity, the amount bought and sold at Pe.
- P1
- A price above equilibrium. At this price firms want to sell more than consumers want to buy.
- Excess Supply
- The gap between the quantity supplied and the quantity demanded at P1, also called a surplus. It pushes the price down.
- P2
- A price below equilibrium. At this price consumers want to buy more than firms want to sell.
- Excess Demand
- The gap between the quantity demanded and the quantity supplied at P2, also called a shortage. It pushes the price up.
- Arrows
- The price falls from P1 and rises from P2, in both cases towards Pe, as the market corrects itself.
Key explanations
- 1
The market is in equilibrium at price Pe and quantity Qe, where the quantity demanded equals the quantity supplied. At any other price the market is in disequilibrium.
- 2
At P1, above Pe, the quantity supplied is greater than the quantity demanded. Firms cannot sell everything they produce, so there is excess supply, also called a surplus.
- 3
Firms with unsold stock lower their prices, so the price falls from P1 towards Pe. As it falls, the quantity demanded rises and the quantity supplied falls, until the surplus disappears at Pe.
- 4
At P2, below Pe, the quantity demanded is greater than the quantity supplied. Consumers cannot buy all they want, so there is excess demand, also called a shortage.
- 5
Consumers compete for the limited stock and firms find they can charge more, so the price rises from P2 towards Pe. As it rises, the quantity supplied rises and the quantity demanded falls, until the shortage disappears at Pe.
- 6
These changes show the three functions of the price mechanism. A change in price signals a shortage or a surplus to buyers and sellers. It gives them an incentive to change what they do, as when a higher price encourages firms to produce more. It also rations the good, because only those willing and able to pay the new price buy it.
- 7
Neither curve shifts. The market adjusts by moving along the existing demand and supply curves, so it is the quantity demanded and the quantity supplied that change, not demand and supply themselves.
Example exam question
Using a diagram, explain how the price mechanism removes excess supply and excess demand in a market.
Show example answer
In the diagram, the market clears at Pe and Qe. If the price is P1, above Pe, the quantity supplied is greater than the quantity demanded, so there is excess supply. Firms with unsold stock cut their prices, and as the price falls towards Pe the quantity demanded rises and the quantity supplied falls until the surplus is gone. If the price is P2, below Pe, the quantity demanded is greater than the quantity supplied, so there is excess demand. Consumers compete for the limited stock and the price is bid up towards Pe, so the quantity supplied rises and the quantity demanded falls until the shortage is gone. In both cases the price signals the imbalance, gives buyers and sellers an incentive to change how much they buy and sell, and rations the good among those willing and able to pay. Neither curve shifts, so the market adjusts through movements along the demand and supply curves.