IBonomics
Expansionary Monetary Policy – From the Money Market to Aggregate Demand
This diagram links the money market to the AD/AS model. An increase in the money supply lowers the interest rate, which raises consumption and investment and shifts aggregate demand to the right.
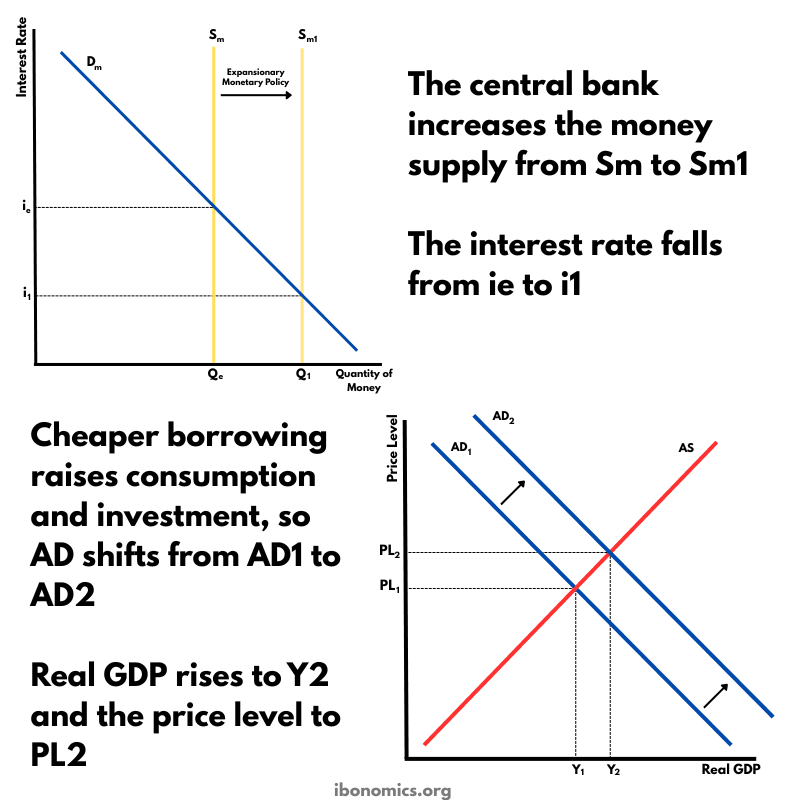
Curves and elements
- Dm
- The demand for money. It slopes downward and does not shift.
- Sm
- The initial money supply, vertical because the central bank sets it.
- Sm1
- The money supply after the central bank increases it.
- ie
- The initial equilibrium interest rate, where Sm crosses Dm.
- i1
- The lower interest rate, where Sm1 crosses Dm.
- Qe
- The initial quantity of money.
- Q1
- The larger quantity of money at i1.
- Expansionary Monetary Policy
- The rightward shift of the money supply from Sm to Sm1.
- AD1
- Aggregate demand before the interest rate falls.
- AD2
- Aggregate demand after consumption and investment rise.
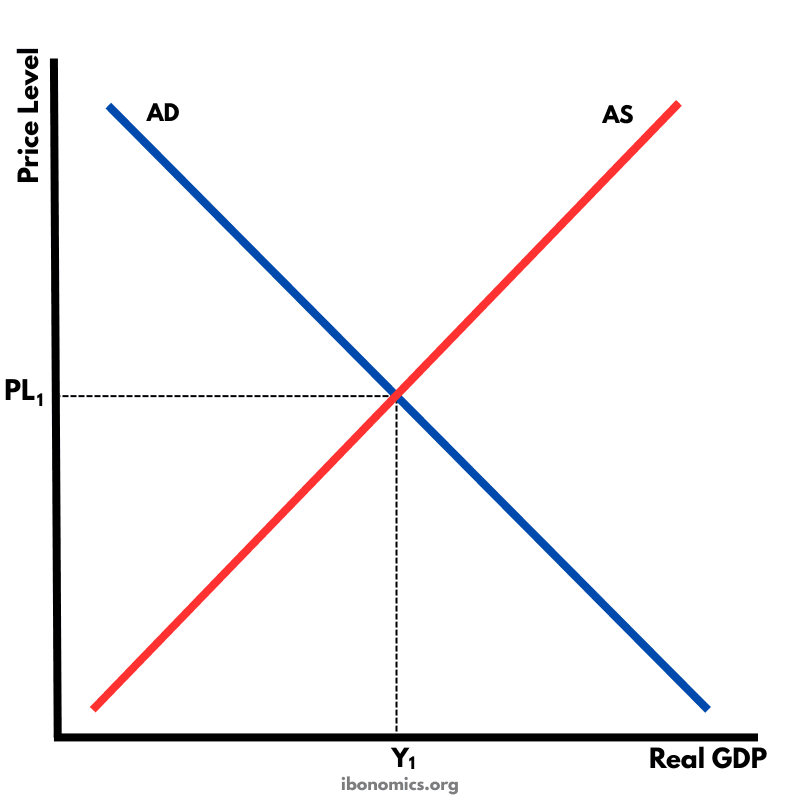
- AS
- Aggregate supply, which slopes upward and does not shift.
- PL1
- The initial price level.
- PL2
- The higher price level after AD increases.
- Y1
- Real GDP before the policy.
- Y2
- The higher real GDP after the policy.
Key explanations
- 1
The central bank increases the money supply from Sm to Sm1. At the old interest rate ie there is now more money than people want to hold, so the interest rate falls to i1.
- 2
A lower interest rate makes borrowing cheaper and saving less rewarding. Households spend more, especially on goods bought on credit, and firms invest more because new projects cost less to finance.
- 3
Consumption and investment are components of aggregate demand, so AD shifts right from AD1 to AD2.
- 4
Because AS slopes upward, the new equilibrium has both higher real GDP, from Y1 to Y2, and a higher price level, from PL1 to PL2.
- 5
How far AD shifts depends on how strongly households and firms respond to the lower interest rate. If confidence is low, they may borrow little even when rates fall, so the policy has a weaker effect.
Example exam question
Using a money market diagram and an AD/AS diagram, explain how expansionary monetary policy can increase real GDP.
Show example answer
Expansionary monetary policy increases the money supply. In the money market diagram, Sm shifts right to Sm1, and because there is more money than people want to hold at ie, the equilibrium interest rate falls to i1. The lower interest rate reduces the cost of borrowing, so households spend more on consumption and firms carry out more investment. Since consumption and investment are components of aggregate demand, AD shifts right from AD1 to AD2 in the AD/AS diagram. Real GDP rises from Y1 to Y2 and the price level rises from PL1 to PL2. The size of the effect depends on how responsive borrowing is to the interest rate, so the policy may be weaker when confidence is low.