IBonomics
Kuznets Curves – Income Inequality and Pollution as an Economy Grows
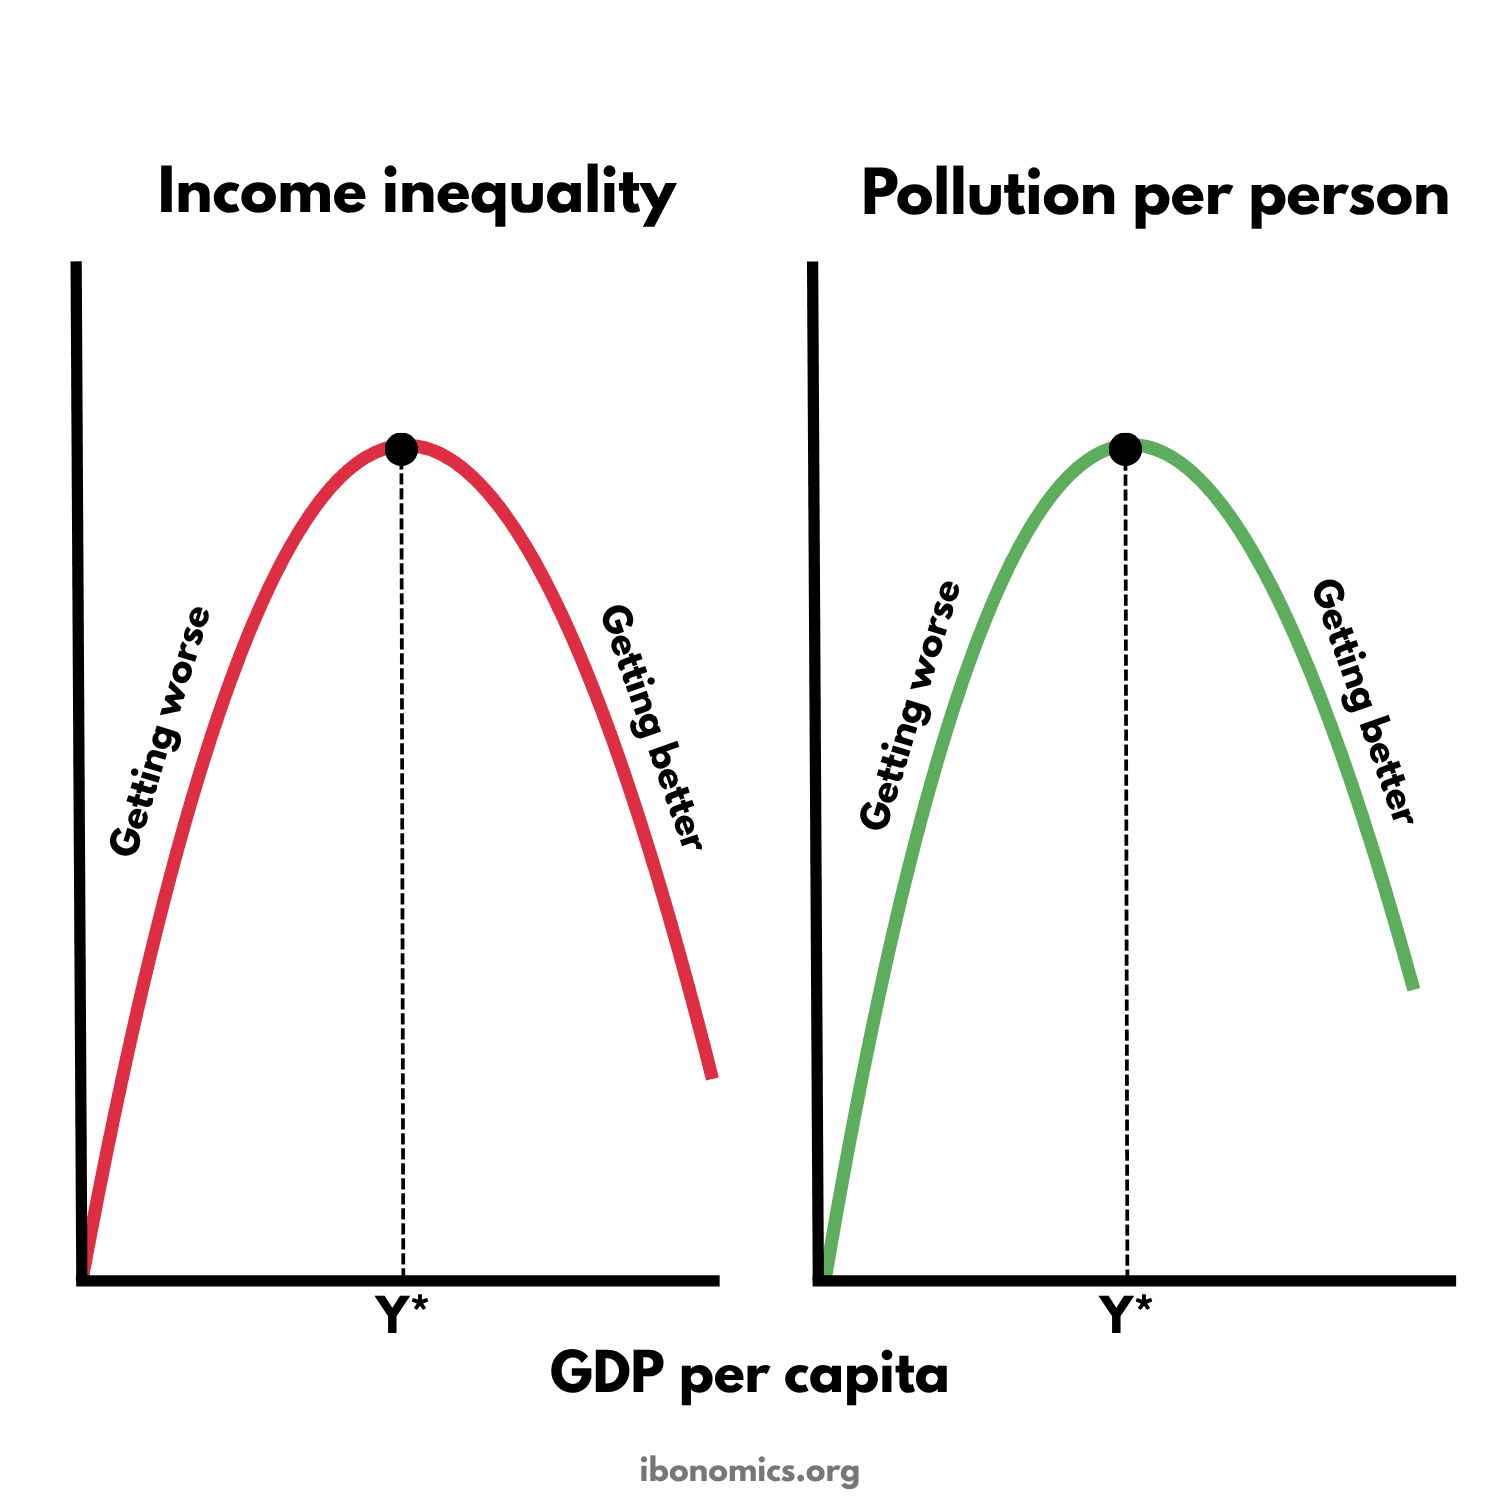
This diagram shows two inverted U-shaped curves. As GDP per capita rises, income inequality and pollution per person first get worse, peak at Y* and then get better. The first is the Kuznets curve and the second the environmental Kuznets curve. Both describe patterns that some countries have followed, not laws that every economy must follow.
This diagram goes beyond the IB Economics syllabus, so you don't need to learn it for your exams. It is here to deepen your understanding of the topic.
Simon Kuznets, who won the Nobel Prize in Economics in 1971, proposed the inequality curve in 1955. In the early 1990s Gene Grossman and Alan Krueger found the same shape for some kinds of air pollution, which became known as the environmental Kuznets curve.
Curves and elements
- Income inequality
- The red curve. Inequality rises as a low-income economy starts to grow, is highest at Y* and then falls as GDP per capita keeps rising.
- Pollution per person
- The green curve, known as the environmental Kuznets curve. Pollution per person rises in the early stages of industrialisation, is highest at Y* and then falls.
- Getting worse
- Before Y*, growth comes with rising inequality and pollution, as workers leave farming for industry and output relies on heavy industry and dirty energy.
- Getting better
- Beyond Y*, growth comes with falling inequality and pollution, as education spreads, output shifts to services and cleaner technology, and governments tax, redistribute and regulate more.
- Y*
- The turning point, the level of GDP per capita at which each curve is highest. In practice it differs between inequality and each kind of pollution.
- GDP per capita
- Output per person, a measure of average income. Moving to the right shows the economy growing over time.
Key explanations
- 1
Simon Kuznets argued that inequality rises in the early stages of growth. As an economy industrialises, workers move from farming into better-paid jobs in factories and cities, while many stay behind on low farm incomes, and the owners of capital gain most. The gap between the groups widens, so inequality gets worse.
- 2
Later, most workers have moved into the higher-paid sectors, education spreads, wages rise and workers gain bargaining power. Richer governments can also afford progressive taxes and transfer payments. Beyond Y*, inequality falls as GDP per capita keeps rising.
- 3
The environmental Kuznets curve gives pollution the same shape. Early industrialisation relies on heavy industry and cheap, dirty energy, so pollution per person rises. At higher incomes, output shifts towards services, cleaner technology becomes affordable, people demand a cleaner environment and governments tighten regulation, so pollution per person falls.
- 4
The evidence is mixed. Inequality has risen again in many high-income economies since the 1980s, so falling inequality is not automatic and depends on policy. The environmental curve fits local pollutants, such as sulphur dioxide and smoke, better than carbon dioxide, and a rich country's pollution may fall partly because it imports goods made elsewhere.
- 5
The turning point, Y*, comes at a different income for inequality and for each kind of pollution, even though the diagram marks the same Y* on both curves. Some damage, such as the loss of species, can't be undone once the turning point is reached, which is why waiting for growth to fix it is risky.
- 6
In an IB answer, the curves can support a discussion of whether economic growth reduces inequality, or whether growth is sustainable, as long as the answer treats them as patterns rather than certainties.
Example exam question
Discuss whether economic growth will reduce income inequality in a low-income country.
Show example answer
Economic growth raises GDP per capita, but its effect on inequality depends on how the gains are shared. The Kuznets curve suggests that inequality first rises as a low-income country grows. Workers who move from farming into industry earn far more than those who stay on the land, and owners of capital gain most, so the gap widens. Only beyond a turning point, Y*, do spreading education, rising wages, and progressive taxes and transfer payments make inequality fall. On this view, growth reduces inequality only in the long run, and may widen it for decades first. However, the pattern is not automatic. Inequality has risen again in many high-income economies since the 1980s, and some countries have grown with little rise in inequality because they invested in education, health care and rural development. So growth alone is unlikely to reduce inequality in a low-income country, but growth combined with policies that spread its benefits can.