IBonomics
Laffer Curve – How Tax Rates Affect Tax Revenue
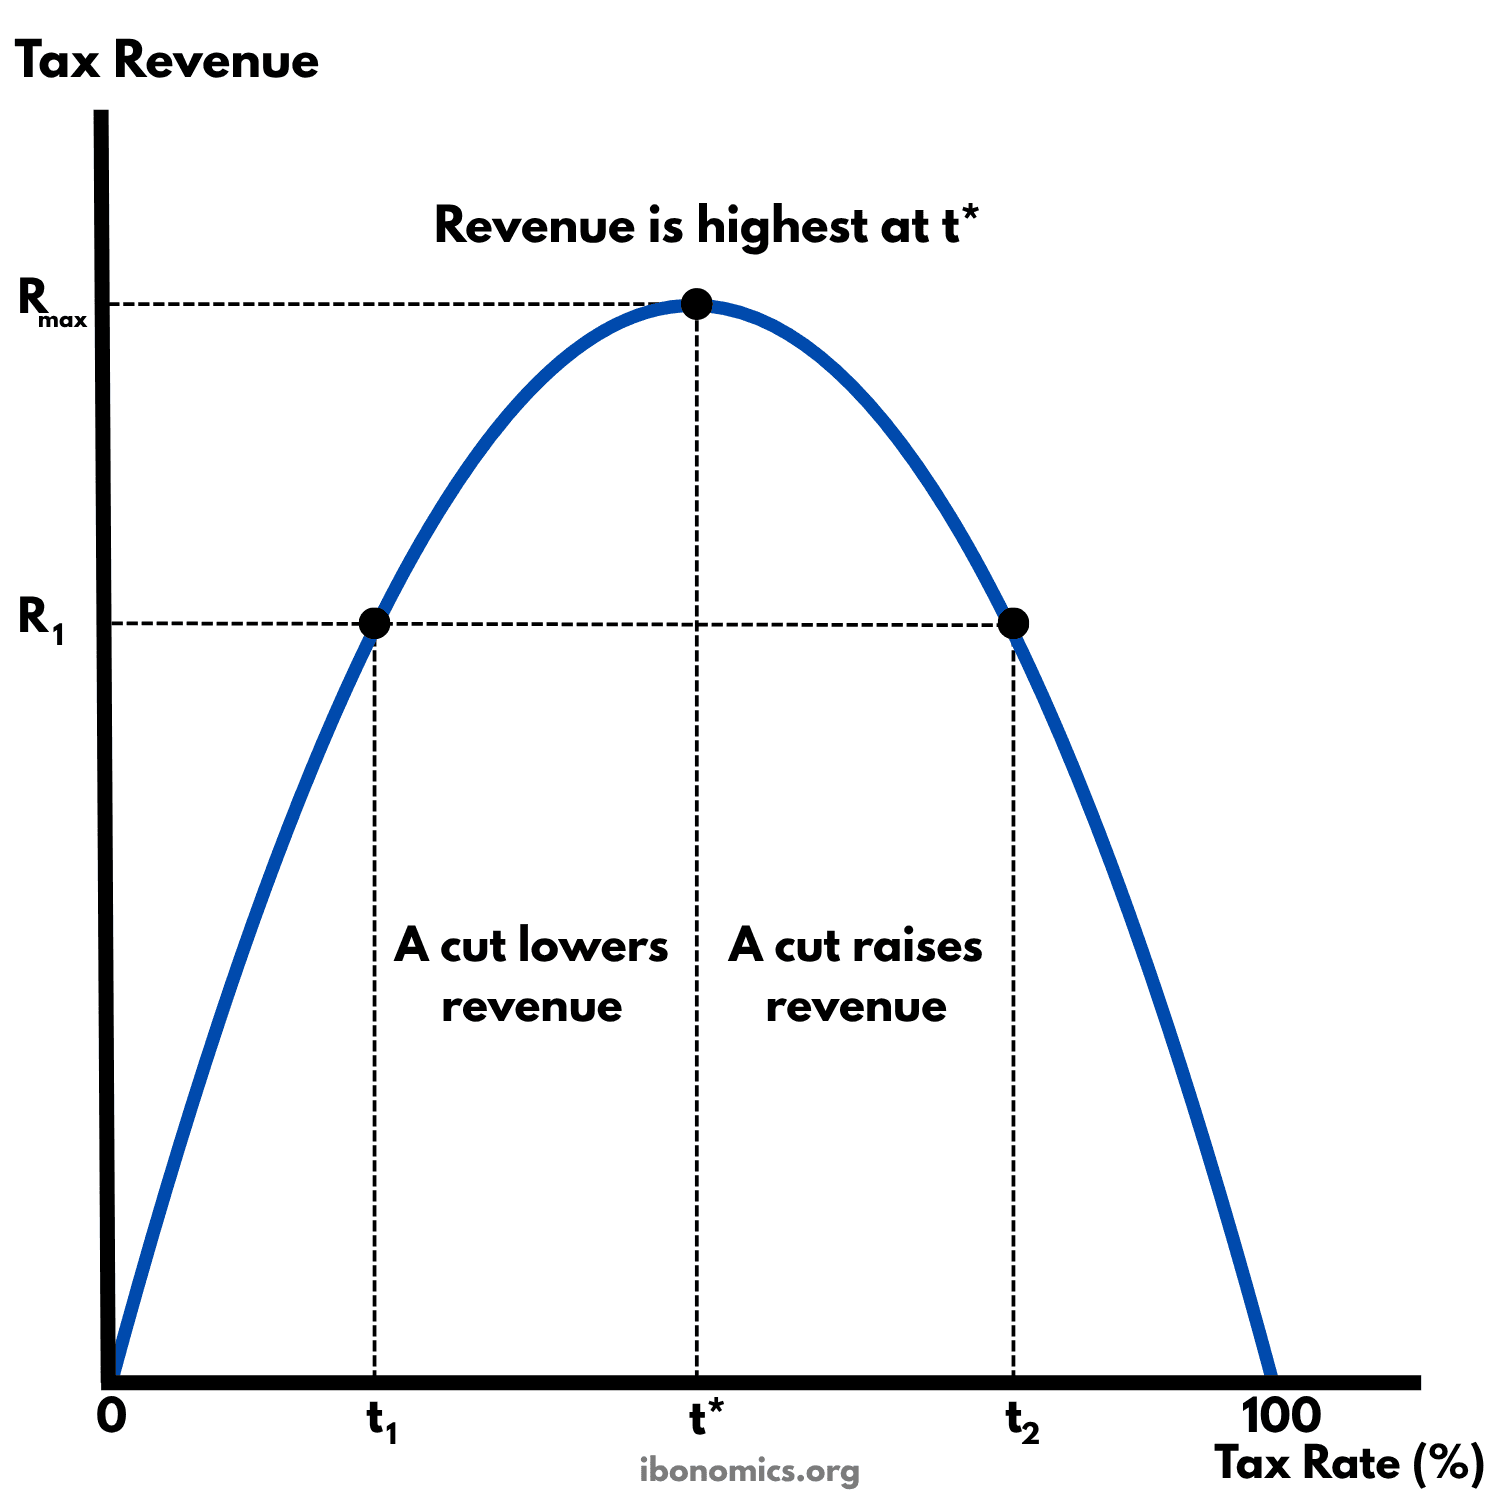
This diagram shows how the revenue from a tax changes as its rate rises from 0% to 100%. Revenue rises at first, is highest at the rate t*, and then falls, because very high rates discourage the work, investment and declared income that the tax falls on. A low rate, t1, and a high rate, t2, can raise the same revenue, R1.
This diagram goes beyond the IB Economics syllabus, so you don't need to learn it for your exams. It is here to deepen your understanding of the topic.
Named after the American economist Arthur Laffer, who sketched the curve in 1974 and made the idea famous. Laffer himself pointed out that it is much older, going back to the 14th-century scholar Ibn Khaldun and to John Maynard Keynes.
Curves and elements
- 100
- A tax rate of 100%. Nobody has a reason to earn or declare taxable income, so revenue is zero.
- Laffer curve
- The tax revenue raised at each tax rate. It starts at zero at a 0% rate, rises to its highest point at t* and falls back to zero at 100%.
- Revenue is highest at t*
- The top of the curve. Above this rate, each rise in the rate shrinks the tax base so much that revenue falls.
- Rmax
- Maximum revenue, the most the tax can raise, at the rate t*.
- R1
- A level of revenue that two different rates, t1 and t2, both raise.
- t*
- The revenue-maximising tax rate. Nobody knows exactly where it lies, and it differs between taxes and between countries.
- t1
- A low tax rate, below t*. Raising it would raise revenue.
- t2
- A high tax rate, above t*. It raises the same revenue as t1, because the government takes a bigger share of a much smaller tax base.
- A cut lowers revenue
- Between 0% and t*, a lower rate loses more revenue on the existing tax base than the extra work and investment it encourages bring in.
- A cut raises revenue
- Between t* and 100%, the rate is so high that it discourages work, investment and declaring income. A lower rate brings back enough taxable activity to raise revenue.
Key explanations
- 1
Tax revenue is the tax rate multiplied by the tax base, the income or spending that is taxed. A higher rate takes a bigger share of each unit of the base, but it can also shrink the base, because people work, invest and declare less income when they keep less of it.
- 2
At a 0% rate the government raises nothing. At a 100% rate it takes all taxable income, so nobody has a reason to earn it, or to declare it, and revenue falls to zero again. Between the two, revenue rises and then falls, so there is a rate, t*, at which it is highest.
- 3
Below t*, the base shrinks only a little as the rate rises, so a higher rate raises more revenue and a cut lowers it. Above t*, the base shrinks so fast, through less work and investment, tax avoidance and evasion, and activity moving into the informal economy, that a higher rate raises less revenue and a cut raises more.
- 4
A low rate, t1, and a high rate, t2, raise the same revenue, R1. At t2 the government takes a bigger share of a much smaller base. Cutting the rate from t2 towards t* would raise revenue and leave people with more of what they earn.
- 5
The curve is used to argue that tax cuts can pay for themselves, as a supply-side policy that raises incentives to work and invest. That only holds above t*. Nobody knows exactly where t* lies, it differs between taxes and between countries, and most studies find that income tax rates in most countries are below it, so a cut there usually lowers revenue, even if it encourages more work.
- 6
In an IB answer, the curve can support an evaluation of cutting income tax as a supply-side or fiscal policy, as long as the answer notes how uncertain the position of t* is.
Example exam question
Evaluate the view that cutting income tax rates will increase a government's tax revenue.
Show example answer
Tax revenue is the tax rate multiplied by the tax base. A cut in income tax rates raises the incentive to work, to take on extra hours and to declare income, so the tax base grows. The Laffer curve shows that whether revenue rises depends on where the tax rate starts. If it is above t*, the revenue-maximising rate, the base grows by enough that revenue rises, as a cut from t2 towards t* shows. If it is below t*, the lower rate loses more revenue than the larger base brings in, so revenue falls. Most studies find that income tax rates in most countries are below t*, and that hours of work respond only a little to tax changes, so a cut is more likely to lower revenue. It may still be worthwhile if it raises output and employment over time, but in the meantime it has to be paid for by borrowing or by cuts in government spending. So the view holds only where tax rates are already very high.