IBonomics
Monopolistic Competition – Short-Run Abnormal Profit
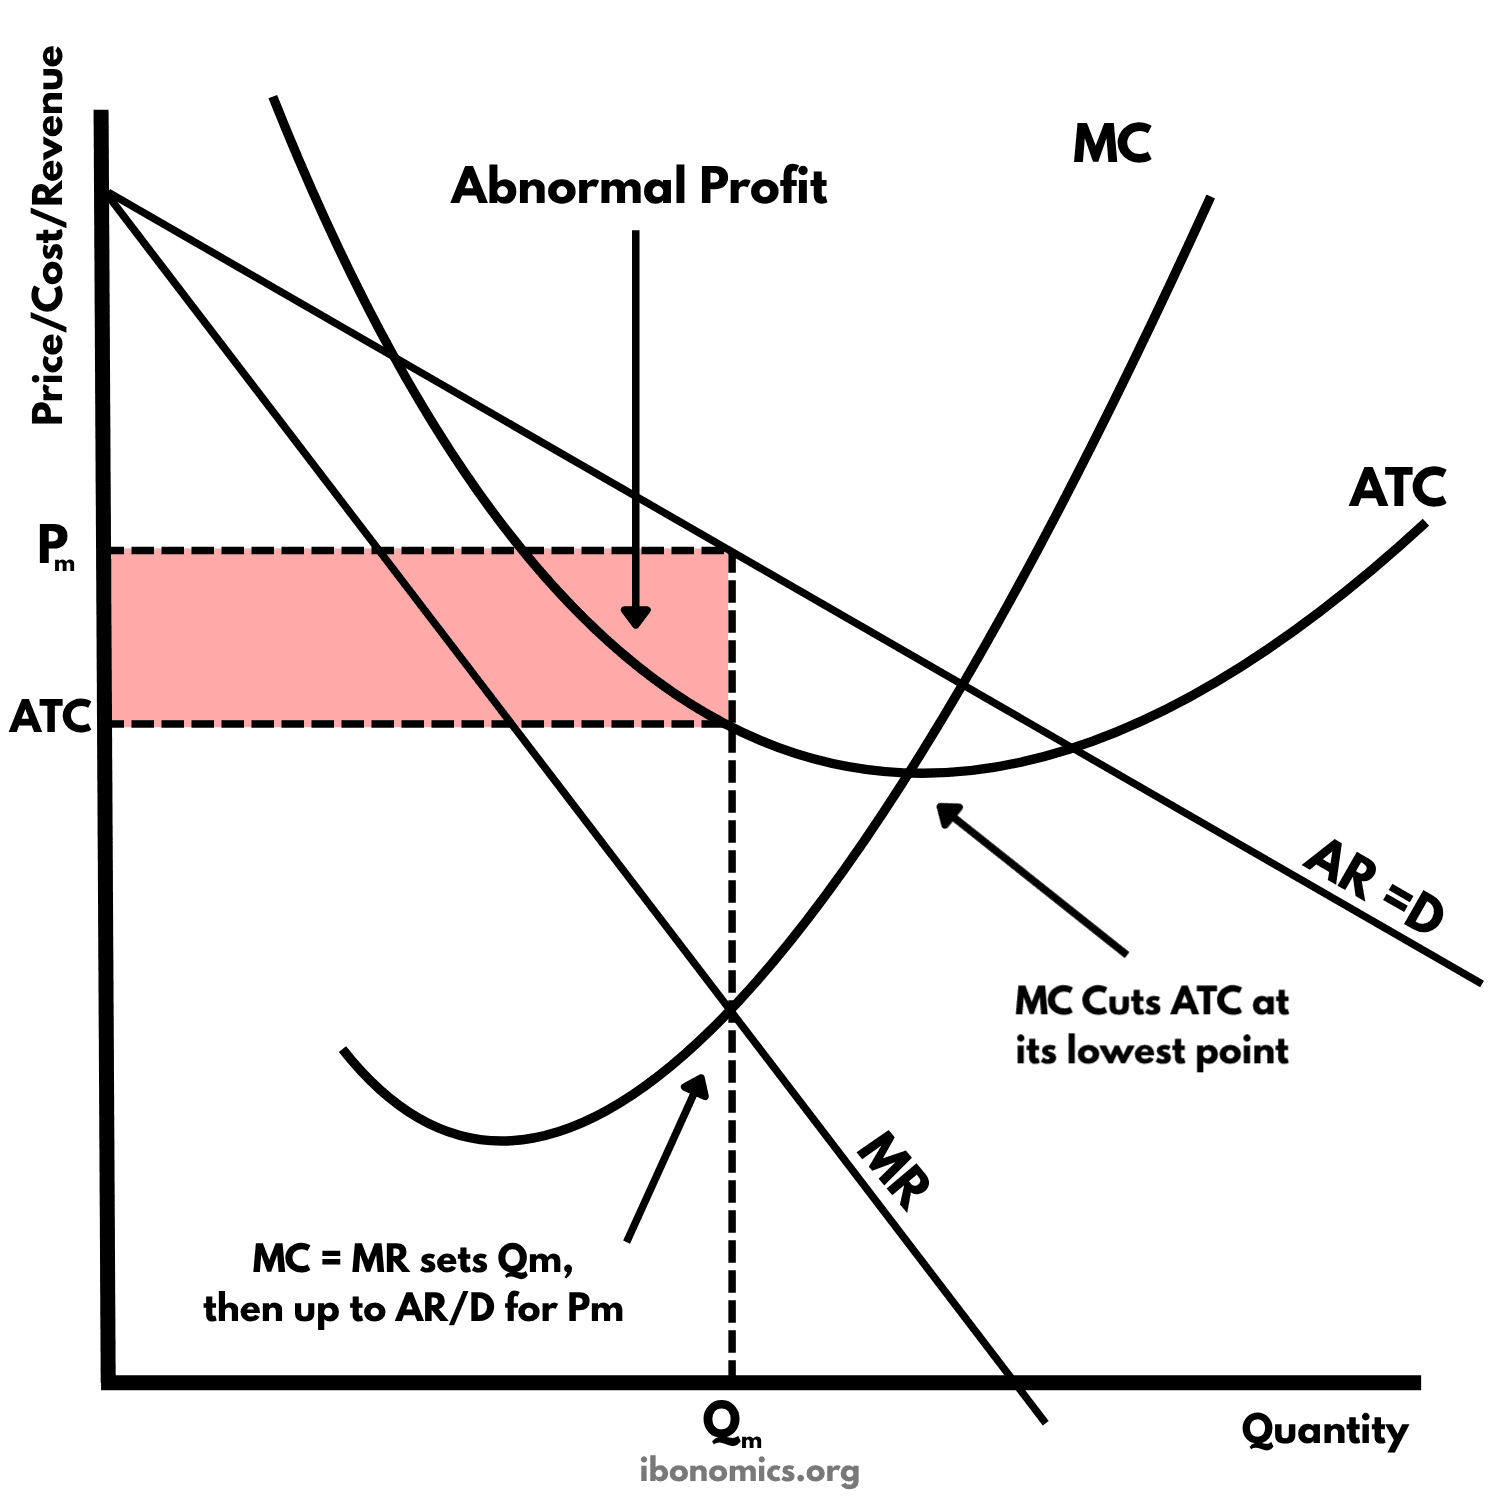
This diagram shows a firm in monopolistic competition making abnormal profit in the short run. It produces Qm, where marginal cost equals marginal revenue, and charges Pm from its demand curve. Because Pm is above average total cost at Qm, the firm earns abnormal profit, which attracts new firms in the long run.
Curves and elements
- MC
- Marginal cost, the extra cost of producing one more unit. It falls at first and then rises, and it cuts ATC at its lowest point.
- ATC
- Average total cost, the cost per unit. The level marked ATC on the vertical axis is the cost per unit at Qm.
- AR = D
- Average revenue, which is also the firm's demand curve. It slopes downward because the product is differentiated, but it is fairly elastic because there are many close substitutes.
- MR
- Marginal revenue, the extra revenue from selling one more unit. It lies below AR because the firm must cut its price to sell more.
- Qm
- The profit-maximising output, where MC = MR.
- Pm
- The price, read from the demand curve at Qm.
- Abnormal Profit
- The shaded rectangle between Pm and ATC, up to Qm. Revenue per unit is above cost per unit, so the firm earns more than normal profit.
Key explanations
- 1
In monopolistic competition, each firm sells a differentiated product, so it faces a downward-sloping demand curve, AR = D. There are many close substitutes, so demand is fairly elastic.
- 2
MR lies below AR, because to sell one more unit the firm has to lower the price of every unit it sells.
- 3
The firm maximises profit where MC = MR, at output Qm. It then charges the highest price consumers will pay for Qm, which is Pm on the demand curve.
- 4
At Qm, the price Pm is above average total cost (ATC), so each unit earns more than it costs to make. The shaded rectangle is the abnormal profit, equal to (Pm − ATC) × Qm.
- 5
MC cuts ATC at its lowest point, and Qm lies to the left of that point, so the firm does not produce at the lowest cost per unit and is not productively efficient. Price is also above MC at Qm, so it is not allocatively efficient either.
- 6
The abnormal profit lasts only in the short run. Barriers to entry are low, so new firms enter with similar products and take customers away. Each firm's demand curve shifts left until AR just touches ATC and only normal profit is left, as the long-run diagram shows.
Example exam question
Using a diagram, explain how a firm in monopolistic competition can make abnormal profit in the short run, and why this profit does not last.
Show example answer
In monopolistic competition, each firm sells a differentiated product, so it faces a downward-sloping demand curve, AR = D, with MR below it. The firm maximises profit where MC = MR, producing Qm, and charges Pm from the demand curve. In the diagram, Pm is above ATC at Qm, so the firm earns abnormal profit equal to (Pm − ATC) × Qm, shown by the shaded rectangle. However, barriers to entry are low, so the profit attracts new firms selling close substitutes. As they enter, each existing firm loses customers and its demand curve shifts left, until price equals ATC and only normal profit is earned in the long run.