IBonomics
Monopoly Compared with Perfect Competition – Price, Output and Welfare Loss
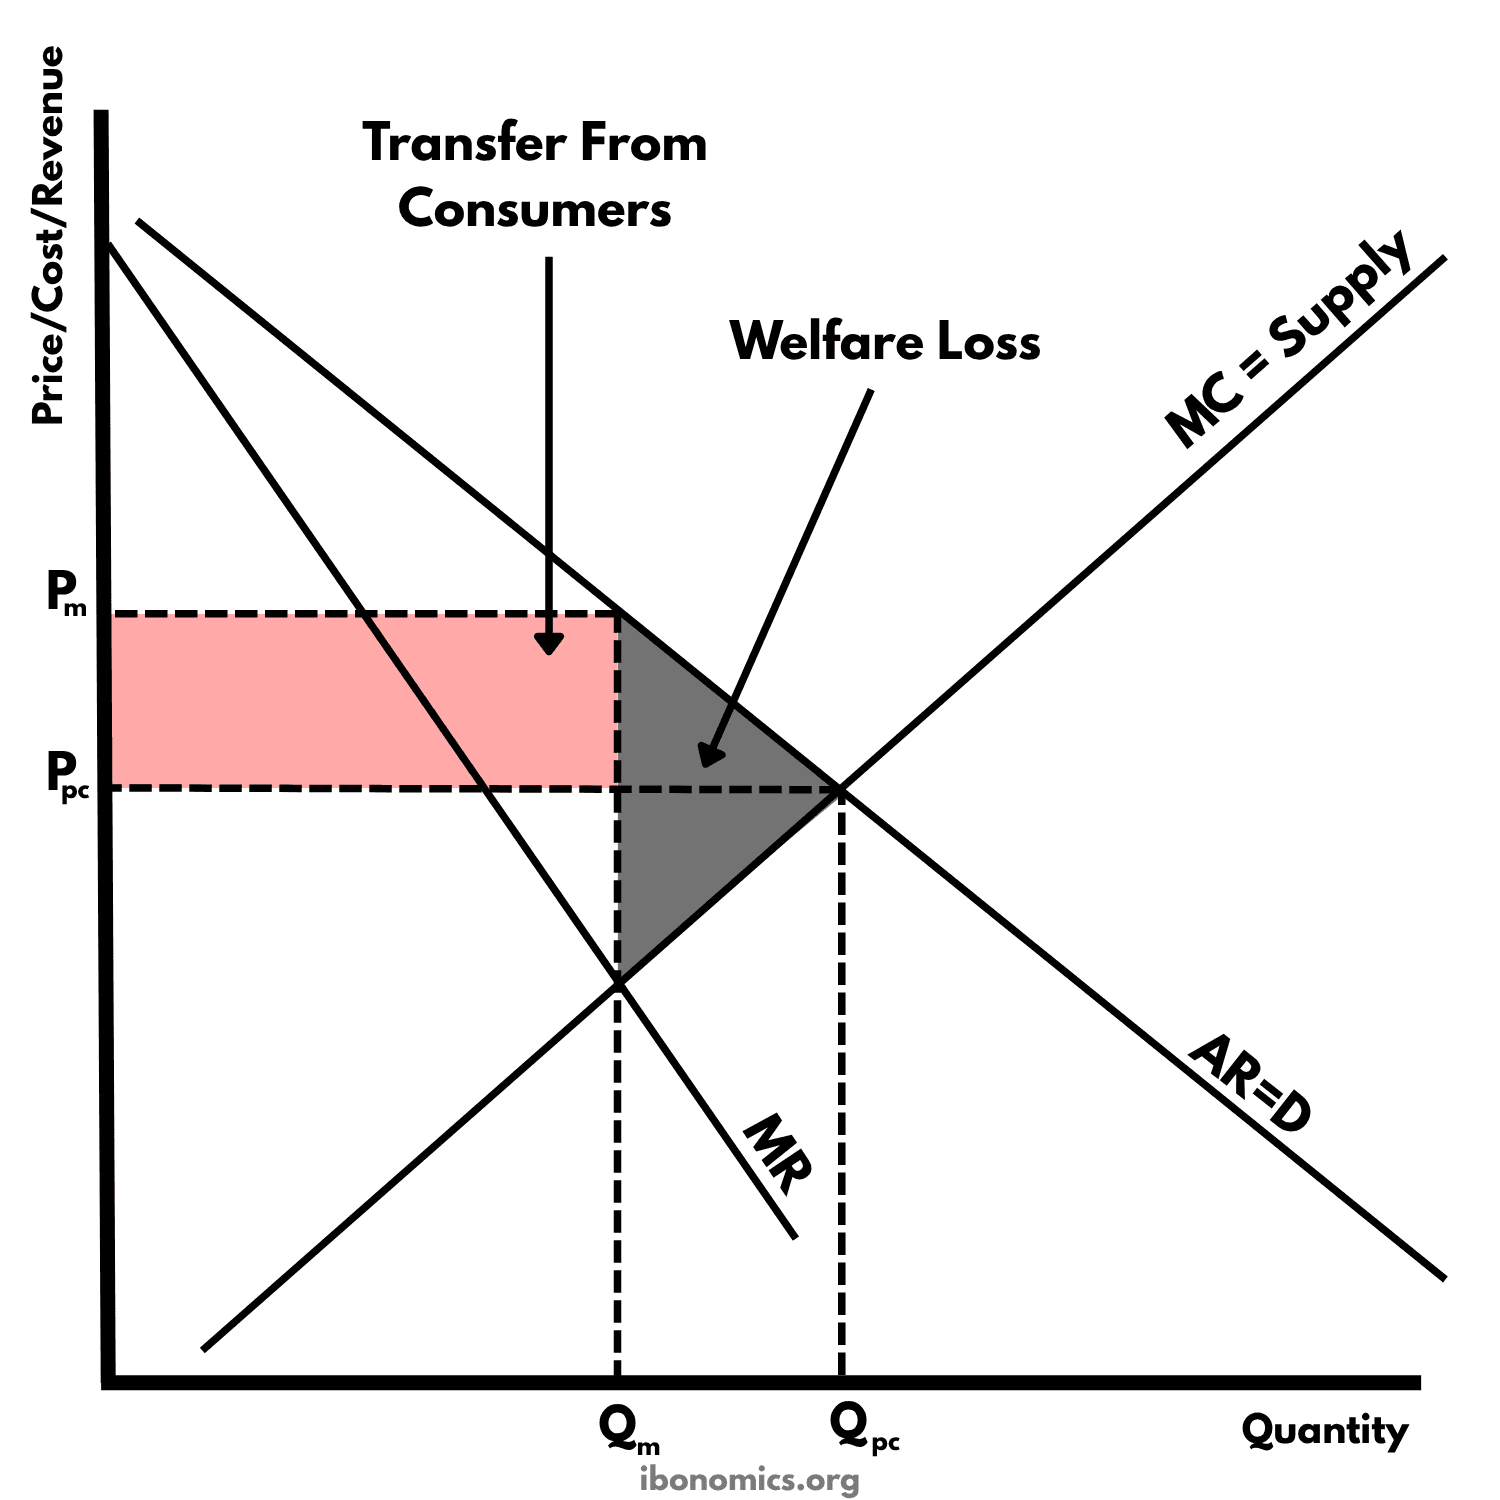
This diagram compares a monopoly with a perfectly competitive industry that has the same costs. The competitive industry produces where supply meets demand, at Qpc and Ppc. A monopoly produces where MC = MR, so it sells less, at Qm, and charges more, at Pm. This transfers surplus from consumers to the firm and creates a welfare loss.
Curves and elements
- AR = D
- Market demand. The monopoly faces all of it, so it is also the firm's average revenue curve.
- MR
- Marginal revenue. It lies below AR, because the monopoly must cut its price to sell more.
- MC = Supply
- Marginal cost. Under perfect competition it is the industry's supply curve, and under monopoly it is the single firm's MC, so both market structures have the same costs.
- Pm
- The monopoly price, read from AR = D at Qm.
- Qm
- The monopoly's output, where MC = MR.
- Ppc
- The perfectly competitive price, where MC = Supply meets AR = D.
- Qpc
- The perfectly competitive output, where price equals marginal cost.
- Transfer From Consumers
- The rectangle between Pm and Ppc, up to Qm. Consumers lose this surplus because they pay more, and the monopoly gains it as profit.
- Welfare Loss
- The grey triangle between AR = D and MC, from Qm to Qpc. It is the surplus lost because these units are not produced.
Key explanations
- 1
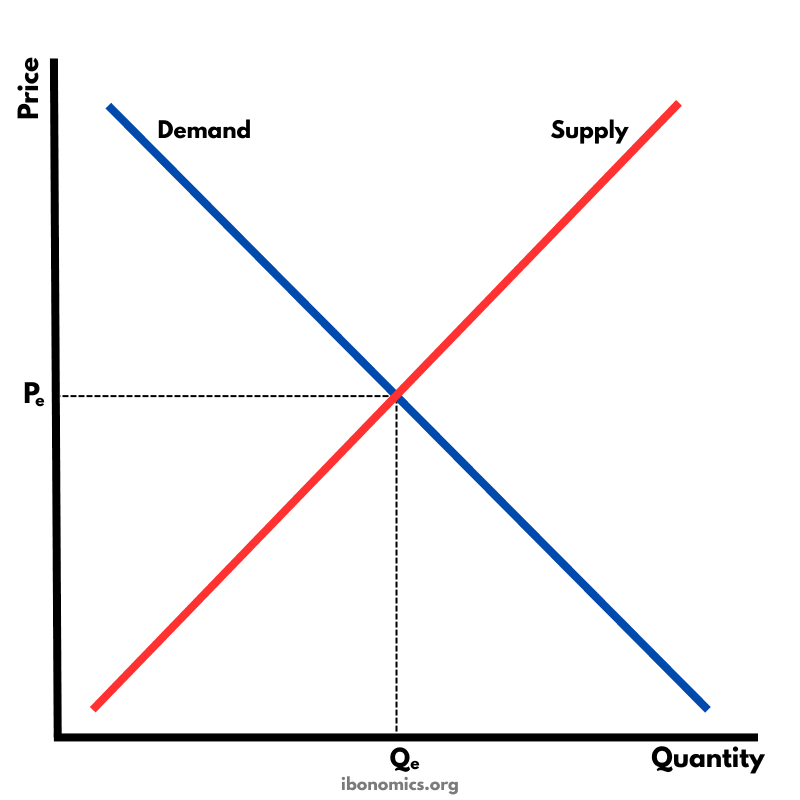
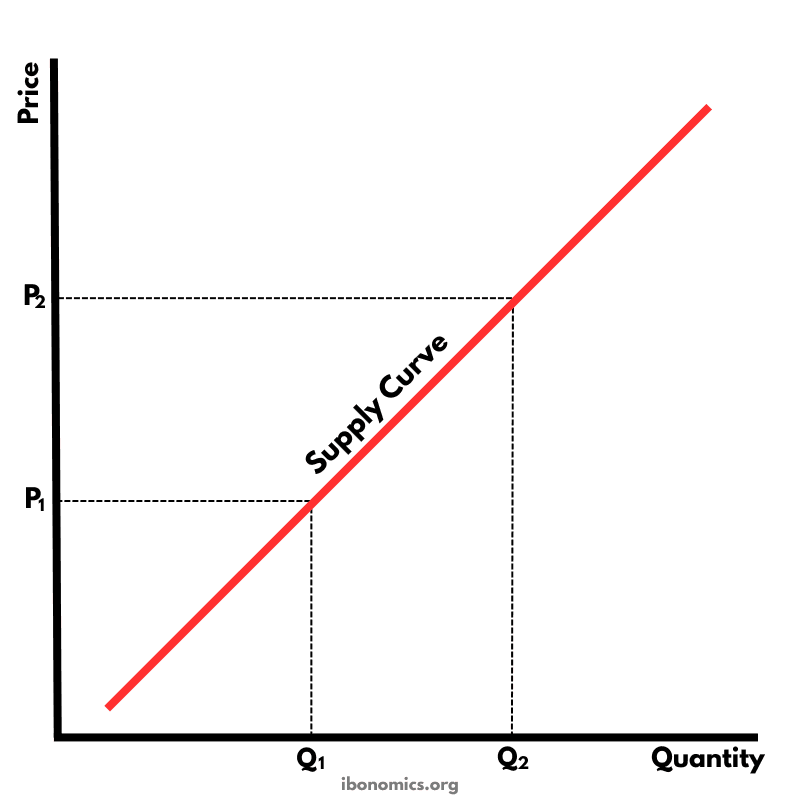
The diagram assumes the industry has the same costs whether it is perfectly competitive or run by one firm. In perfect competition the industry's supply curve is the sum of the firms' marginal cost curves, so if one firm takes over the whole industry, that curve becomes its MC. This is why it is labelled MC = Supply.
- 2
In perfect competition, the market settles where supply meets demand, at price Ppc and quantity Qpc. Price equals marginal cost there, so the industry is allocatively efficient.
- 3
A monopoly faces the whole market demand curve, AR = D, with MR below it. It maximises profit where MC = MR, producing Qm, and charges Pm, the highest price consumers will pay for Qm.
- 4
So the monopoly sells less than the competitive industry, because Qm is below Qpc, and charges more, because Pm is above Ppc.
- 5
The shaded rectangle between Pm and Ppc, up to Qm, is consumer surplus that the monopoly takes as extra profit. Consumers lose it but the firm gains it, so it is a transfer rather than a loss to society.
- 6
The grey triangle between AR = D and MC, from Qm to Qpc, is the welfare loss. These units are worth more to consumers than they cost to produce, but the monopoly does not produce them, so their surplus is lost. At Qm, price is above marginal cost, so the monopoly is allocatively inefficient.
- 7
The comparison depends on costs being the same. A monopoly may have lower costs because of economies of scale, or use its profit to fund research and development, so in practice its price may not be higher than a competitive industry's. Natural monopolies are the clearest case.
Example exam question
Using a diagram, compare the price, output and efficiency of a monopoly with those of a perfectly competitive industry that has the same costs.
Show example answer
If a perfectly competitive industry were taken over by one firm with the same costs, the industry's supply curve would become the monopoly's MC curve. In perfect competition, the market produces Qpc at price Ppc, where supply meets demand and price equals marginal cost, so resources are allocated efficiently. The monopoly instead produces where MC = MR, at Qm, and charges Pm from the demand curve, so it produces less and charges a higher price. The rectangle between Pm and Ppc up to Qm is consumer surplus transferred to the monopoly as profit. The triangle between demand and MC from Qm to Qpc is a welfare loss, because units that consumers value above their cost are no longer produced. However, a monopoly may have lower costs through economies of scale, so in practice the comparison may be less unfavourable to monopoly.