Natural Monopoly – Regulation and SubsidyHL
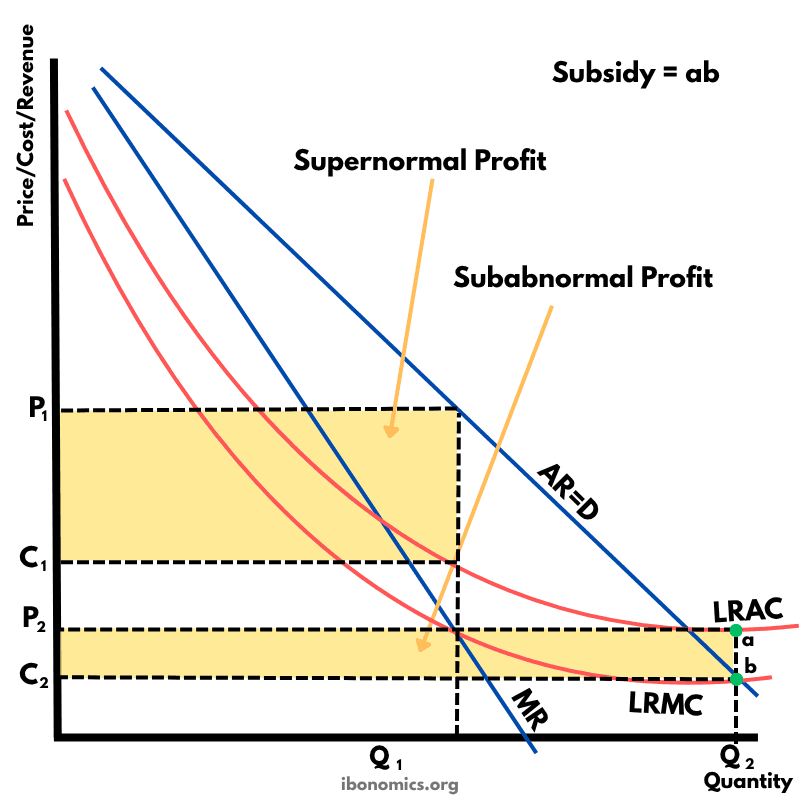
MicroeconomicsA diagram illustrating a natural monopoly regulated to achieve allocative efficiency through subsidies. It highlights supernormal and subabnormal profit regions, along with the required subsidy to sustain production at the socially optimal quantity.
Curves and elements
- ar
- AR = D: The average revenue or demand curve, downward sloping.
- mr
- MR: Marginal revenue curve, lies below AR due to price reduction on all units.
- lrac
- LRAC: Long-run average cost, continuously decreasing due to economies of scale.
- lrmc
- LRMC: Long-run marginal cost, intersects MR at the profit-maximizing quantity.
- q1
- Q1: Profit-maximizing output where MR = LRMC, yielding supernormal profit.
- p1
- P1: Price charged at Q1, generating supernormal profit (area between P1 and C1).
- c1
- C1: Cost per unit at Q1, based on LRAC.
- q2
- Q2: Allocatively efficient output where AR = LRMC.
- p2
- P2: Price consumers pay at Q2 under government regulation.
- c2
- C2: Cost per unit at Q2, above the price, resulting in subnormal profit.
- subsidy
- ab: Vertical distance representing the per-unit subsidy needed to cover the loss at Q2.
Key explanations
- 1
A natural monopoly arises when one firm can supply the entire market at a lower cost than multiple firms due to large economies of scale.
- 2
At Q1, the firm maximizes profit where marginal revenue (MR) intersects long-run marginal cost (LRMC), charging price P1 and enjoying supernormal profit (shaded area between P1 and C1).
- 3
Allocative efficiency occurs at Q2, where the price (P2) equals LRMC, but at this point, the firm incurs a subnormal profit since cost C2 exceeds price P2.
- 4
To sustain production at Q2, the government provides a subsidy equal to the vertical distance ab — the loss per unit that the firm would incur at the allocatively efficient level.
- 5
This type of regulation improves societal welfare by increasing output and lowering prices, despite requiring taxpayer funding to cover the firm's losses.
Example exam question
Using a diagram, explain how a government can regulate a natural monopoly to achieve allocative efficiency. What are the implications of such regulation?
Show example answer
A natural monopoly can produce at a lower cost due to economies of scale, but will normally restrict output to maximize profit, causing allocative inefficiency. The government can intervene by encouraging production at the point where price equals marginal cost (P = MC). However, at this output (Q2), the firm would incur losses. To cover this, the government can provide a subsidy equal to the vertical distance ab. This ensures the firm can operate efficiently while preventing financial losses, though it requires public spending.