IBonomics
Awareness Campaign to Correct a Negative Externality of Consumption
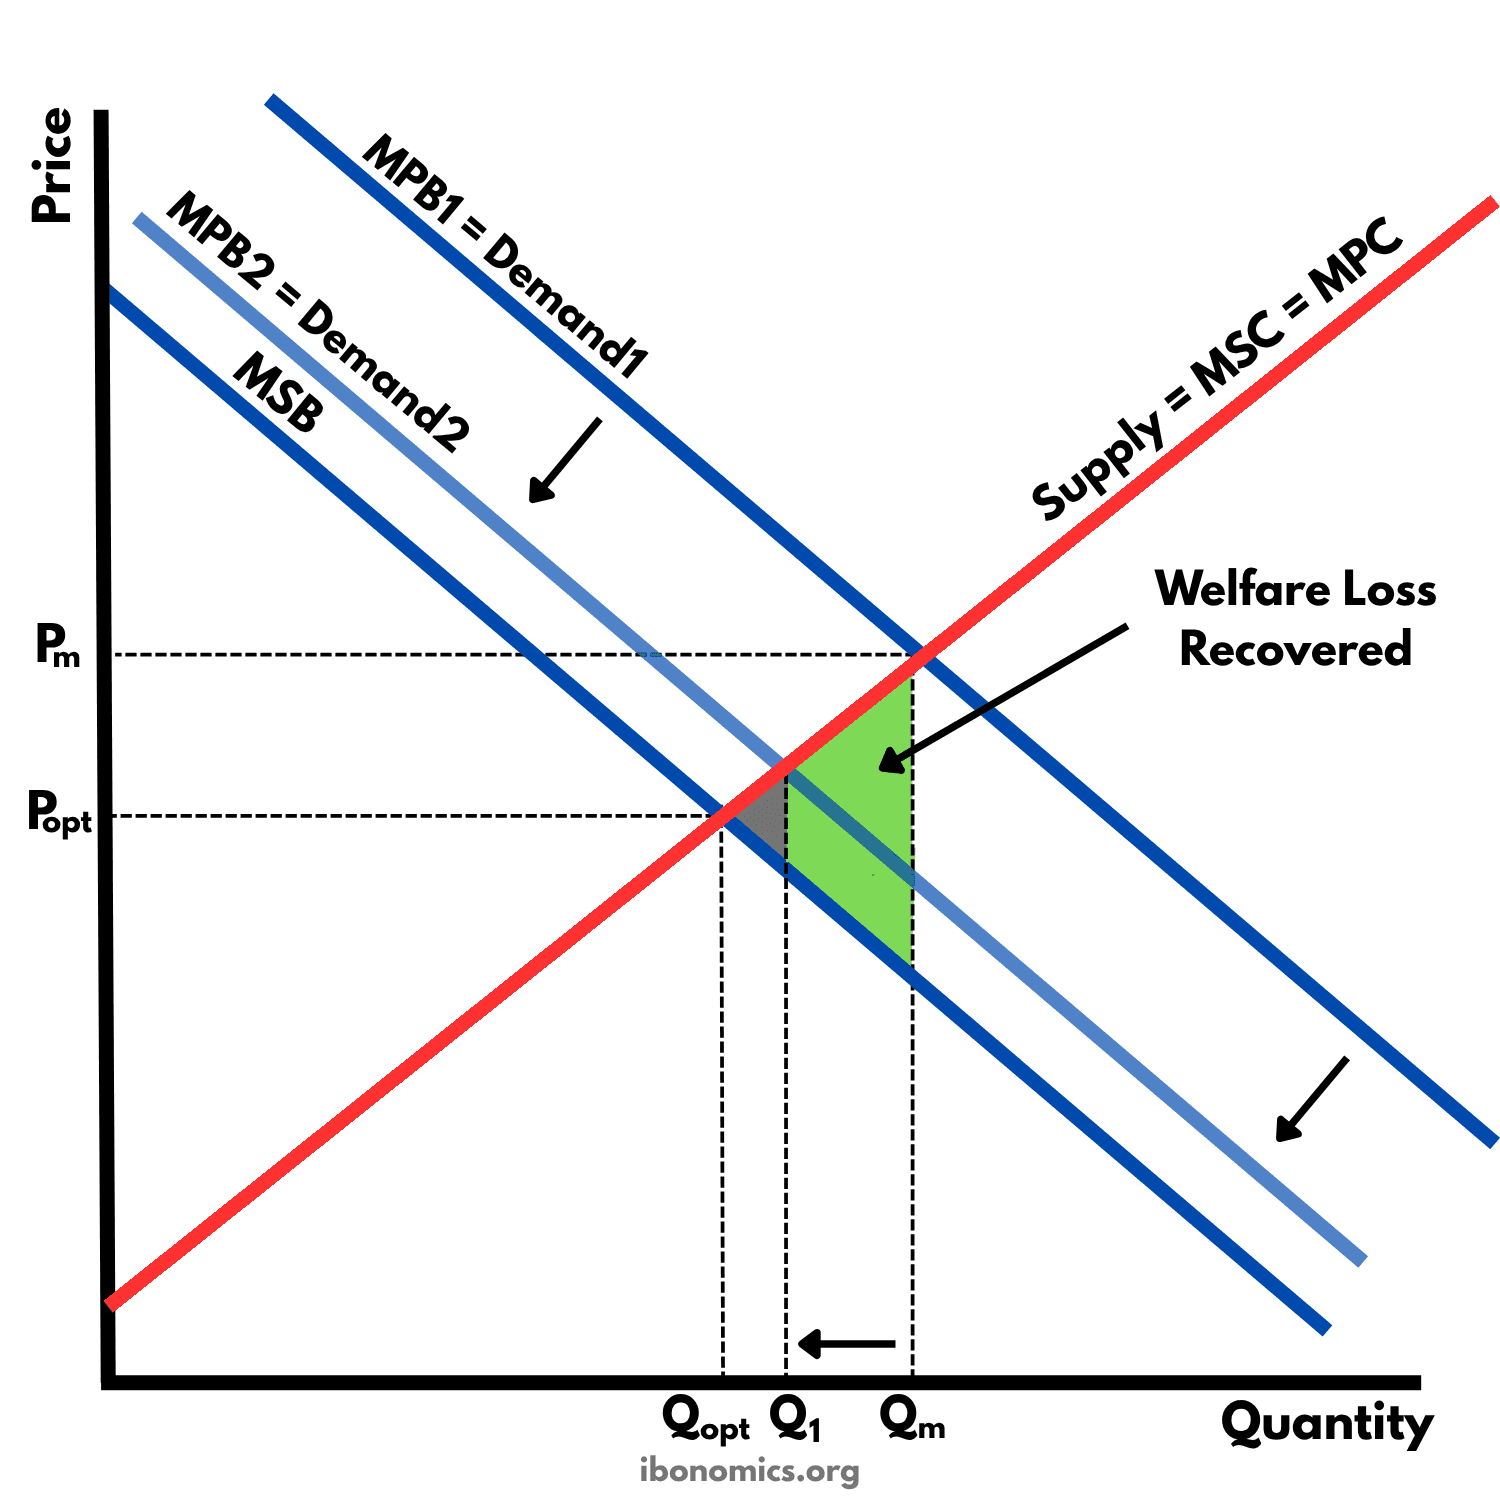
This diagram shows how an awareness campaign, such as health warnings or anti-smoking advertising, can reduce a negative externality of consumption. The campaign makes consumers value the good less, so demand shifts left and consumption falls from Qm to Q1. It is hard to know how far demand will fall, and here it stops short of Qopt, so some welfare loss remains.
Curves and elements
- MPB1 = Demand1
- Marginal private benefit before the campaign, based on what consumers believe each unit is worth to them.
- MPB2 = Demand2
- Marginal private benefit after the campaign. Consumers know more about the harm, so they value each unit less and demand shifts left.
- MSB
- Marginal social benefit, the benefit to society once the external cost on third parties is counted. The campaign does not move it, so Qopt stays where MSB meets supply.
- Supply = MSC = MPC
- There is no externality in production, so marginal private cost and marginal social cost are the same. The campaign does not move supply.
- Price effect
- The price falls from Pm towards Popt as demand shifts left along the supply curve.
- Quantity effect
- Consumption falls from Qm to Q1, but stays above the socially optimal quantity Qopt.
- Welfare Loss Recovered
- The green area between the supply curve and MSB from Q1 to Qm. These units are no longer consumed, so their welfare loss is gone.
- Remaining welfare loss
- The grey triangle between the supply curve and MSB from Qopt to Q1. These units are still overconsumed, because demand did not fall far enough.
Key explanations
- 1
Consuming goods such as cigarettes imposes external costs on third parties, so the marginal social benefit (MSB) lies below the marginal private benefit (MPB). The free market consumes Qm at price Pm, more than the socially optimal quantity Qopt.
- 2
An awareness campaign, such as health warnings on packets or anti-smoking advertising, tells consumers about the harm the good causes. Consumers value the good less, so demand falls and the curve shifts left from MPB1 = Demand1 to MPB2 = Demand2.
- 3
Supply does not change, so the market moves down along the supply curve. Consumption falls from Qm to Q1, and the price falls from Pm towards Popt.
- 4
The units between Q1 and Qm are no longer consumed, so the welfare loss on them is recovered. This is the green area between the supply curve and MSB.
- 5
Consumption is still above Qopt, so the grey triangle between Qopt and Q1 is welfare loss that remains. Demand would have to shift all the way to MSB to remove it.
- 6
A tax can in principle be set equal to the external cost, but nobody knows in advance how far a campaign will shift demand, so it may stop short of Qopt, as it does here. Campaigns also cost money to run and take time to change habits, but they do not raise the price, so they do not fall hardest on low-income consumers the way a tax does.
Example exam question
Using a diagram, explain how an awareness campaign could reduce a negative externality of consumption, and why it may not remove the welfare loss completely.
Show example answer
In the diagram, consuming the good imposes external costs on third parties, so MSB lies below MPB and the free market overconsumes at Qm instead of Qopt. An awareness campaign, such as anti-smoking advertising, informs consumers about the harm the good causes, so they value it less and demand shifts left from MPB1 = Demand1 to MPB2 = Demand2. Consumption falls from Qm to Q1, and the welfare loss on the units between Q1 and Qm is recovered. However, the government cannot know in advance how far demand will shift. Here it stops short of MSB, so consumption stays above Qopt and the welfare loss between Qopt and Q1 remains. Campaigns also take time to change habits, although unlike a tax they do not raise the price for low-income consumers.