IBonomics
Perfect Competition – Short-Run Abnormal Profit
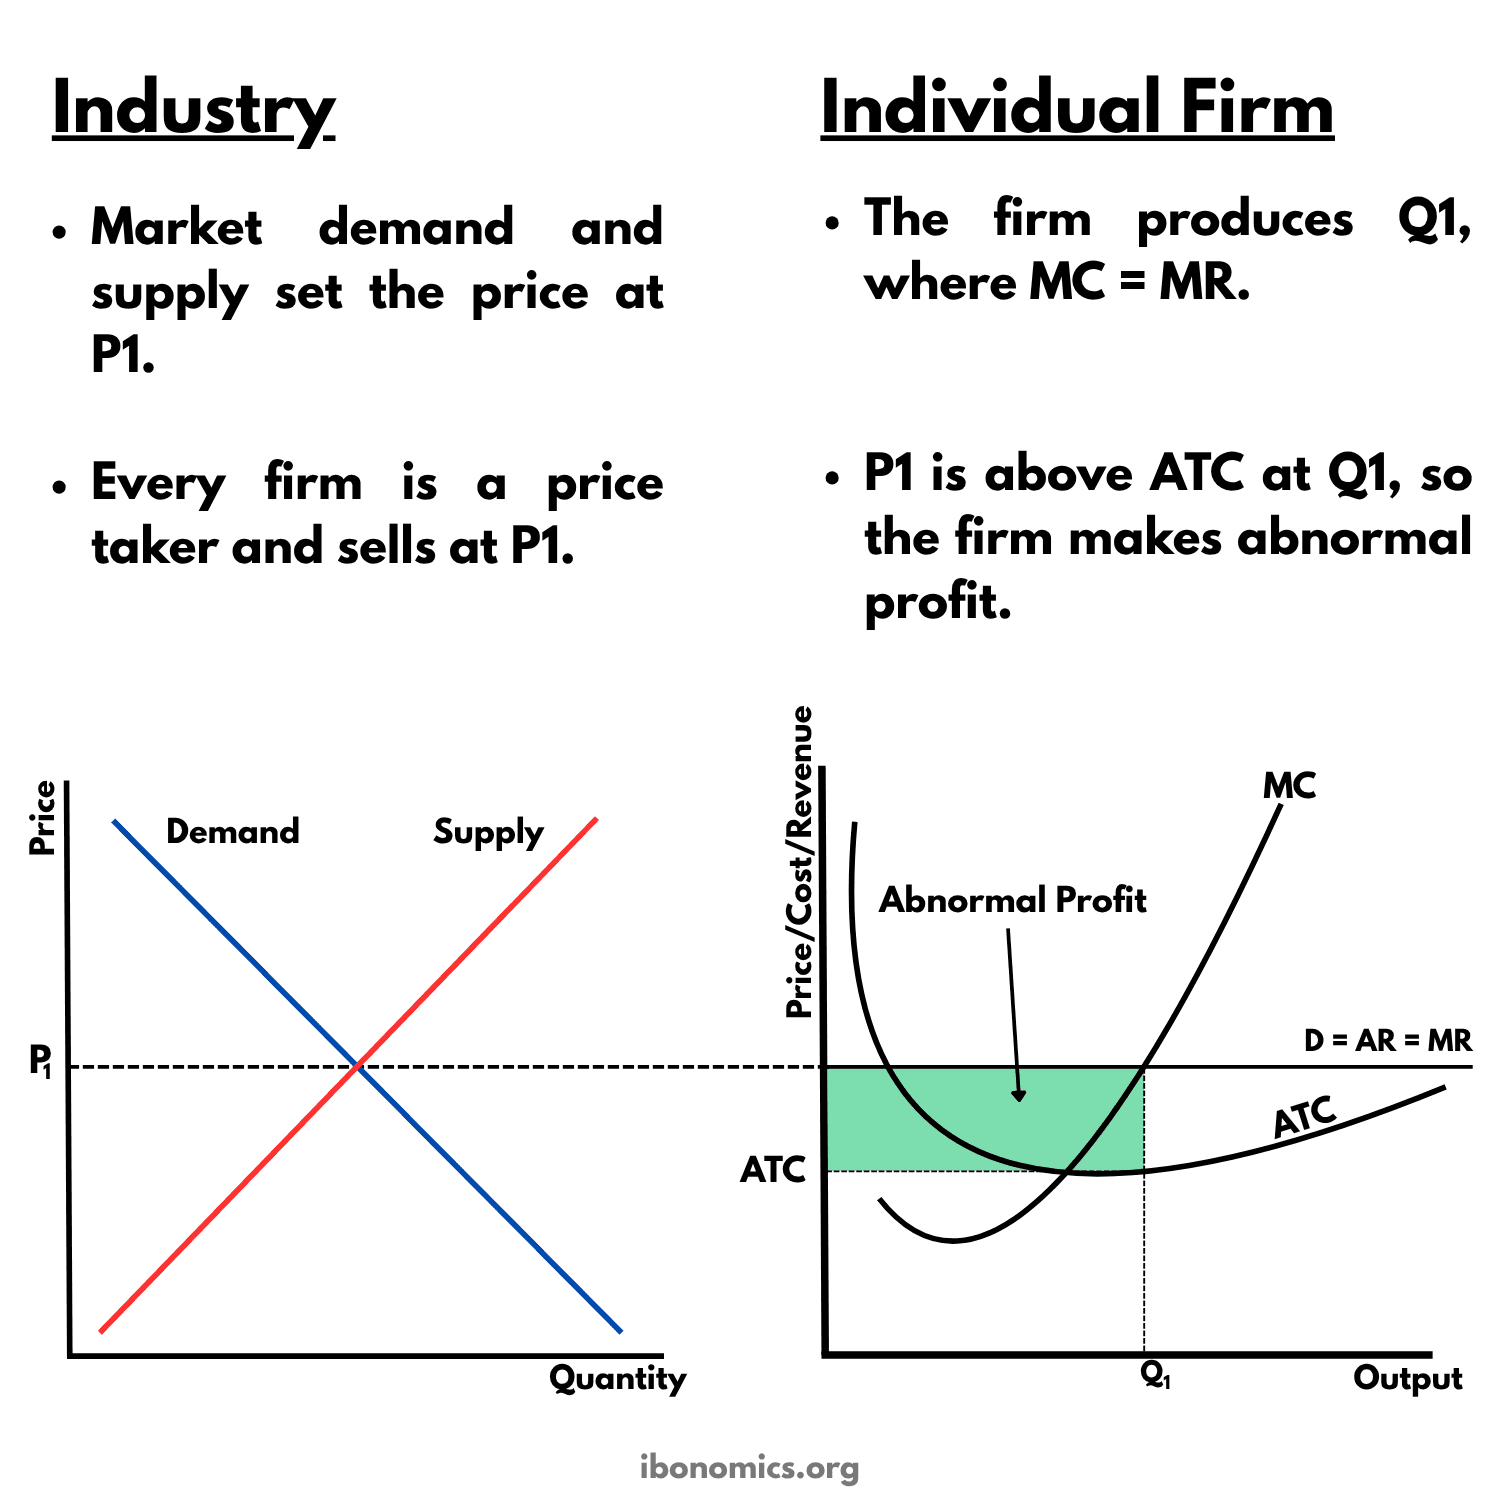
This diagram shows a perfectly competitive firm making abnormal profit in the short run. Market demand and supply in the industry set the price P1, which each firm takes as given. The firm produces Q1, where MC = MR, and because P1 is above average total cost at Q1, it earns abnormal profit.
Curves and elements
- Demand
- Market demand for the product across the whole industry.
- Supply
- Market supply from all the firms in the industry.
- P1
- The price set where market demand meets market supply. The dashed line carries it across to the firm, which must accept it.
- MC
- The firm's marginal cost. It cuts ATC at its lowest point and meets D = AR = MR at Q1.
- ATC
- The firm's short-run average total cost, the cost per unit. The level marked ATC on the vertical axis is the cost per unit at Q1.
- D = AR = MR
- The firm's demand curve, horizontal at P1 because the firm is a price taker. Every unit sells for P1, so average and marginal revenue both equal the price.
- Q1
- The firm's profit-maximising output, where MC = MR.
- Abnormal Profit
- The shaded rectangle between P1 and ATC, up to Q1. The price is above cost per unit, so the firm earns more than normal profit.
Key explanations
- 1
In the industry panel, market demand and supply set the price at P1. There are many firms selling identical products, so no single firm can change this price.
- 2
Each firm is a price taker, so it can sell any amount at P1. Its demand curve is horizontal at P1, and because every unit sells for the same price, D = AR = MR.
- 3
The firm maximises profit where MC = MR, which gives output Q1.
- 4
At Q1, P1 is above average total cost (ATC), so the firm earns abnormal profit. The shaded rectangle shows it, equal to (P1 − ATC) × Q1.
- 5
The diagram uses the short-run ATC curve, because in the short run some factors of production, such as the firm's premises, are fixed.
- 6
The abnormal profit does not last. There are no barriers to entry, so new firms join the industry, supply shifts right and the price falls until each firm earns only normal profit, as the long-run diagram shows.
Example exam question
Using a diagram, explain how a firm in perfect competition can make abnormal profit in the short run.
Show example answer
In perfect competition, market demand and supply in the industry set the price at P1. Each firm is a price taker, so its demand curve is horizontal at P1 and D = AR = MR. The firm maximises profit where MC = MR, producing Q1. In the diagram, P1 is above ATC at Q1, so the firm earns abnormal profit equal to (P1 − ATC) × Q1, shown by the shaded rectangle. Because there are no barriers to entry, this profit attracts new firms. Industry supply then shifts right and the price falls until only normal profit is earned in the long run.