IBonomics
Subsidy to Correct a Positive Externality of Consumption
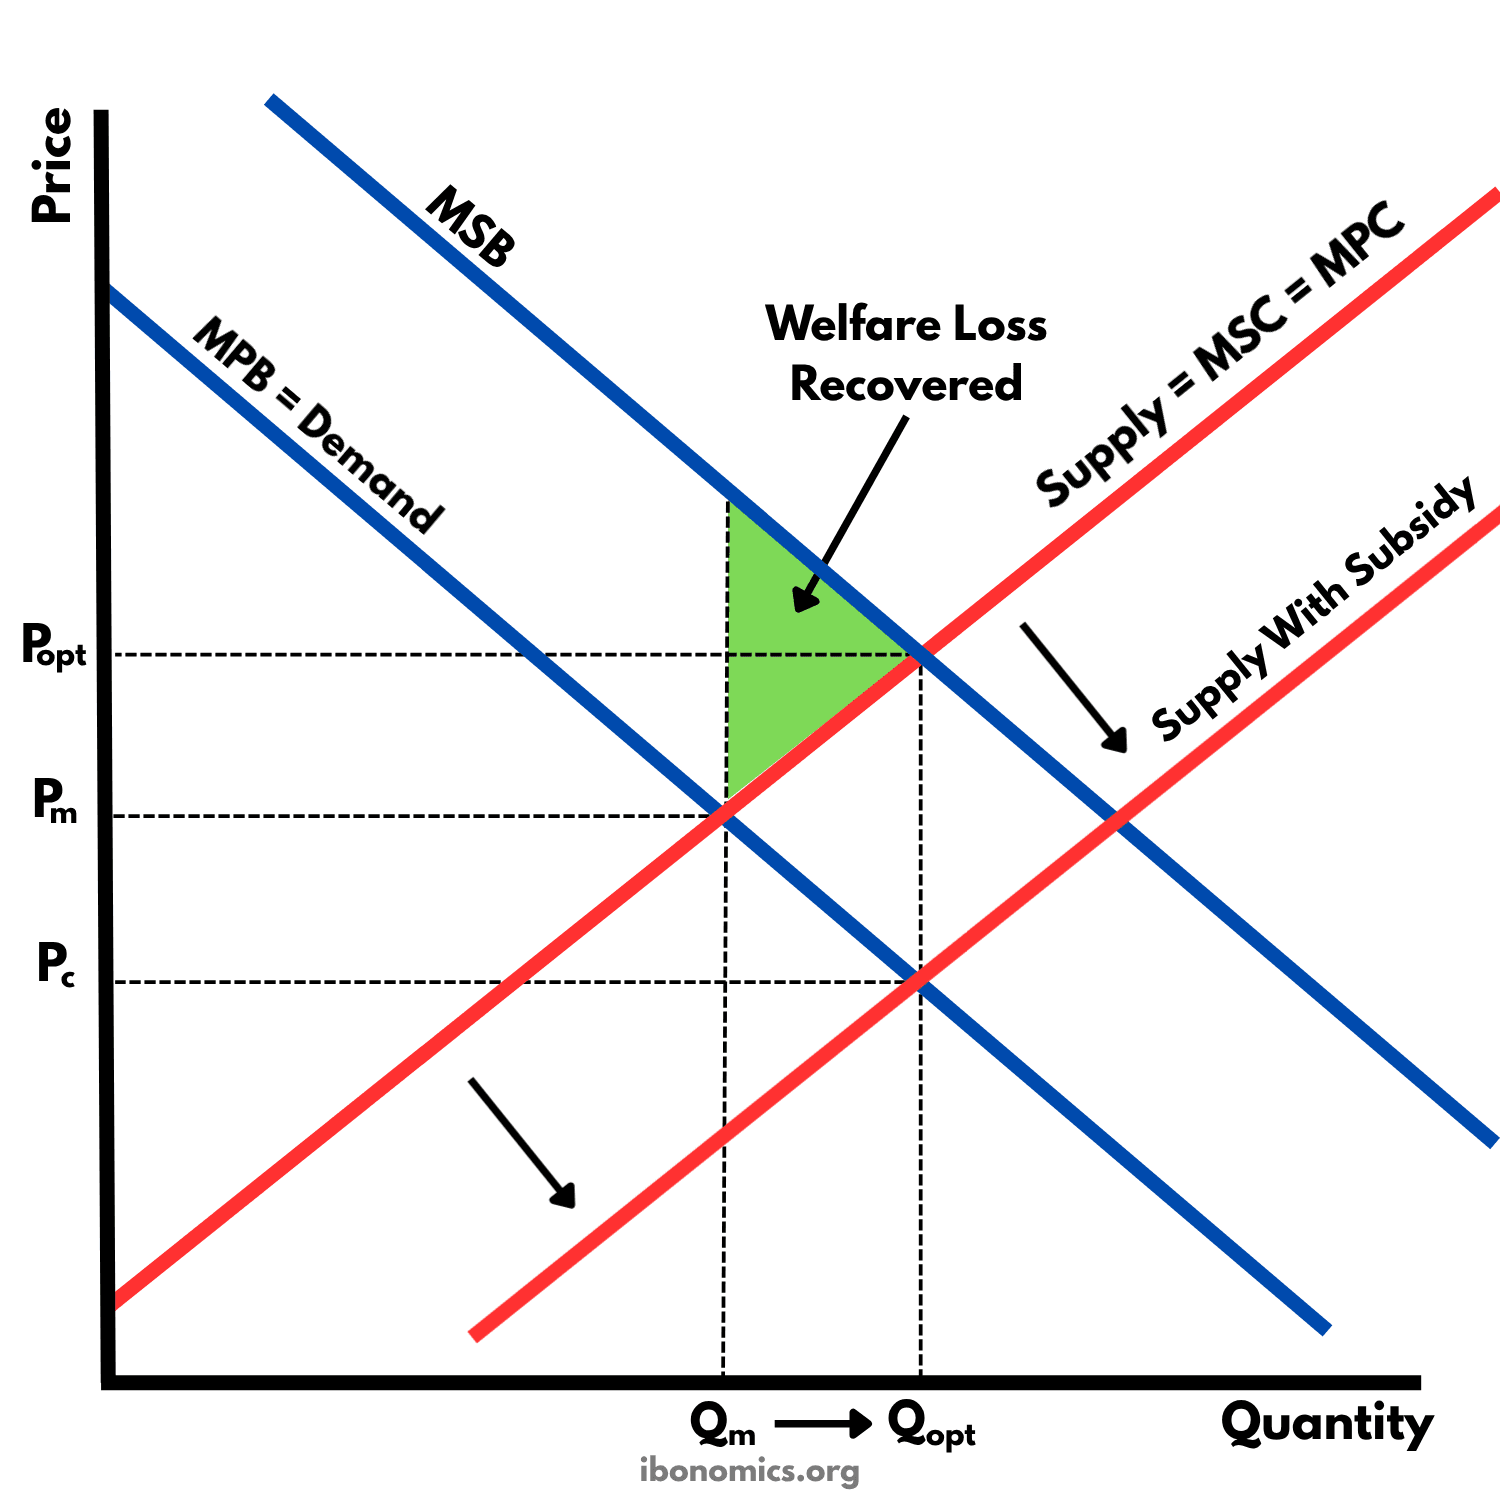
This diagram shows how a subsidy on a good such as vaccinations or education can correct a positive externality of consumption. A subsidy equal to the external benefit shifts supply down, so the price consumers pay falls to Pc and consumption rises from Qm to the socially optimal level Qopt.
Curves and elements
- MSB
- Marginal social benefit, which lies above MPB by the external benefit of each unit, such as the protection a vaccination gives to other people.
- MPB = Demand
- Marginal private benefit, the benefit consumers get from each unit. It leaves out the benefit to others, so consumers buy too little.
- Supply = MSC = MPC
- Supply before the subsidy. There is no externality in production, so marginal private cost and marginal social cost are the same.
- Supply With Subsidy
- Supply after the subsidy, shifted down by the subsidy per unit. It meets MPB = Demand at Qopt.
- Price effect
- Consumers pay Pc, below the free market price Pm, while producers receive Popt, above it. The gap between Popt and Pc is the subsidy per unit.
- Quantity effect
- Consumption rises from Qm to the socially optimal quantity Qopt.
- Welfare Loss Recovered
- The welfare loss the subsidy removes, between MSB and the supply curve from Qm to Qopt. Those units are worth more to society than they cost to produce.
Key explanations
- 1
Consuming goods such as vaccinations and education benefits third parties, so the marginal social benefit (MSB) lies above the marginal private benefit (MPB). The free market consumes Qm at price Pm, less than the socially optimal quantity Qopt.
- 2
The government pays producers a subsidy equal to the external benefit of each unit, the vertical distance between MSB and MPB. The subsidy lowers firms' costs, so the supply curve shifts down from Supply = MSC = MPC to Supply With Subsidy.
- 3
The new equilibrium is where Supply With Subsidy meets MPB = Demand. The price consumers pay falls from Pm to Pc, so the quantity demanded rises from Qm to Qopt, the quantity at which MSB equals MSC.
- 4
Producers receive the price consumers pay plus the subsidy, which is Popt. That is the price at which they are willing to supply Qopt, and the subsidy per unit is the gap between Popt and Pc.
- 5
The green triangle is the welfare loss recovered. The extra units between Qm and Qopt are worth more to society than they cost to produce, so consuming them removes the welfare loss.
- 6
The government pays the subsidy on every unit, so it costs (Popt − Pc) × Qopt, money that could have been spent elsewhere. The external benefit is also hard to measure, so the subsidy may be set too high or too low.
Example exam question
Using a diagram, explain how a subsidy can be used to correct a positive externality of consumption.
Show example answer
In the diagram, consuming the good, such as vaccinations, creates external benefits for third parties, so MSB lies above MPB and the free market underconsumes at Qm instead of Qopt. The government can pay producers a subsidy equal to the external benefit of each unit. This shifts supply down from Supply = MSC = MPC to Supply With Subsidy, so the price consumers pay falls from Pm to Pc and the quantity demanded rises to Qopt, where MSB = MSC. Producers receive Popt, the price consumers pay plus the subsidy. The welfare loss between Qm and Qopt is recovered. However, the subsidy costs the government (Popt − Pc) × Qopt, which has an opportunity cost, and the external benefit is hard to measure, so the subsidy may be set at the wrong level.