 IBonomics
Google and the AI Inference Market: Demand, Supply and Elasticity
Google's AI token usage rose sharply while capacity and efficiency expanded, illustrating demand shifts and short-run inelastic supply.

Key figures
Google API usage
22bn tokens/min
Alphabet reported approximately 22 billion tokens per minute in Q2 2026, up from 16 billion one quarter earlier.
Alphabet 2026 investment
$195–205bn
Alphabet raised its 2026 capital-expenditure guidance as it accelerated capacity to meet growing demand.
Comparable inference cost
$20 → $0.07
Stanford measured the cost per million tokens for GPT-3.5-level performance falling from $20 in November 2022 to $0.07 in October 2024.
Grid expansion time
4–8 years
The IEA reports that building new transmission lines can take four to eight years in advanced economies.
At a glance
- Google's model APIs processed about 22 billion tokens per minute in Q2 2026, up from 16 billion one quarter earlier, showing rapidly rising AI usage.
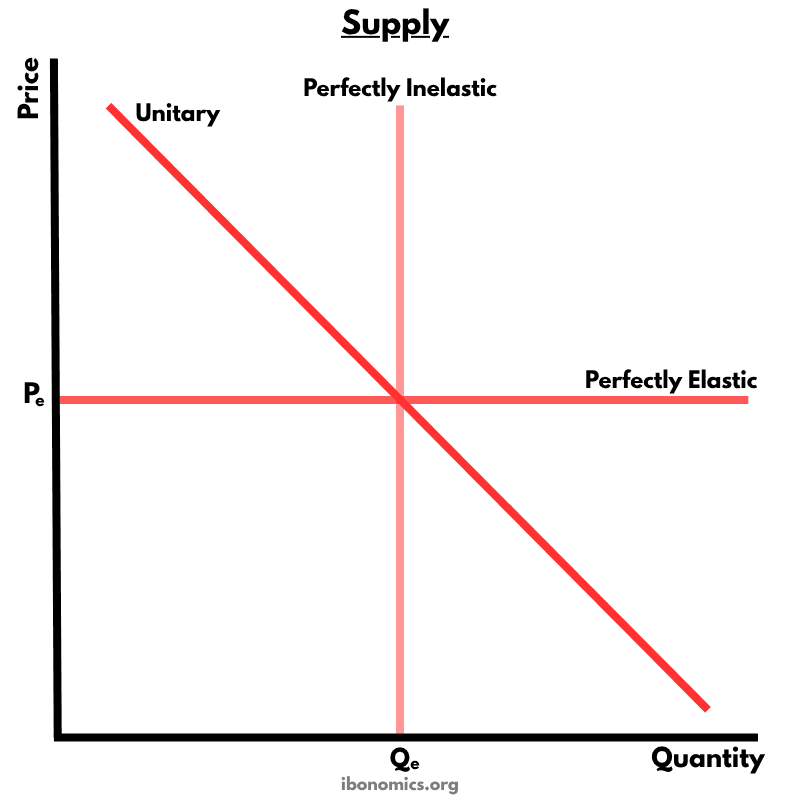
- AI inference supply can be relatively price inelastic in the short run because data centres, advanced chips and electricity connections cannot be expanded quickly.
- Over time, investment in new capacity and improvements in chips and model efficiency shift supply to the right and make supply more elastic.
- Stanford found that the cost of GPT-3.5-level inference fell from $20 to $0.07 per million tokens between November 2022 and October 2024.
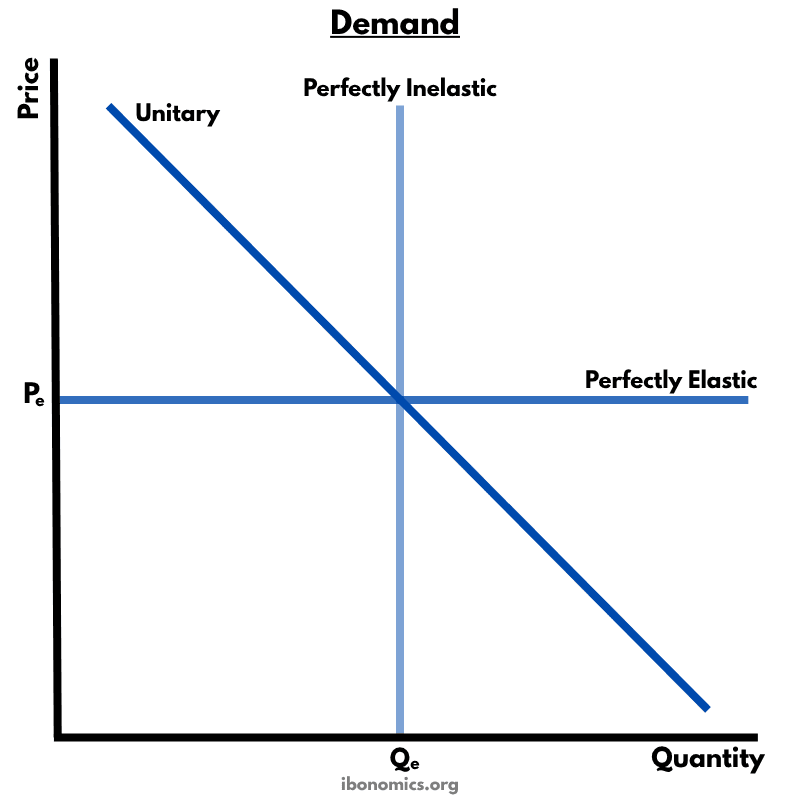
- PED depends on the availability of substitutes: demand for one provider may be elastic when similar models are available, but less elastic for specialized workloads.
Background
Large language models use computing resources every time they process a prompt and generate an answer. Commercial providers such as Google often charge developers according to the number of tokens processed, with prices quoted per million input or output tokens.
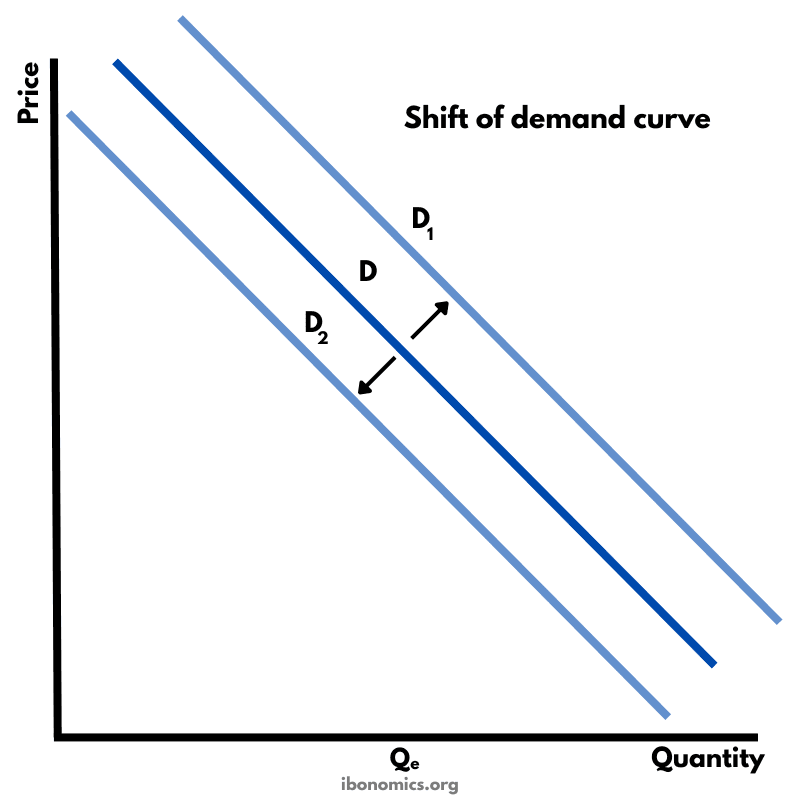
This creates a market for AI inference. Market demand comes from businesses and developers using models for coding, search, customer service, AI agents and other applications. Greater adoption shifts the demand curve to the right.
Supply depends on computing capacity and production costs. Important determinants include data centres, advanced processors, electricity, networking equipment and model efficiency.
In the short run, many of these resources are fixed. A provider cannot immediately build a new data centre or obtain a new grid connection when demand rises, so the supply of inference can be relatively price inelastic.
What happened
Demand for commercial AI inference increased rapidly after generative AI became widely adopted. In Q2 2026, Alphabet reported that Google's model APIs were processing approximately 22 billion tokens per minute, compared with 16 billion one quarter earlier. More than nine million developers were using Google's models each month.
At the same time, Google said it remained supply constrained. Alphabet raised its 2026 capital-expenditure guidance to $195–205 billion, primarily because it was accelerating new computing capacity to meet growing demand. This shows why supply may be difficult to increase immediately but more responsive over a longer period.
Physical infrastructure helps explain the short-run constraint. The International Energy Agency reports long grid-connection queues and estimates that new transmission lines can take four to eight years to build in advanced economies. It has also identified constraints involving electricity equipment and advanced AI hardware.
Despite rapidly rising usage, the quality-adjusted cost of AI inference has fallen sharply. Stanford's AI Index found that the cost of a model achieving GPT-3.5-level performance fell from $20 per million tokens in November 2022 to $0.07 by October 2024. Better hardware, more efficient models and expanding capacity are all consistent with a large rightward shift of supply.
The result is a useful market story: demand for AI inference has shifted right, while technological progress and infrastructure investment have also shifted supply right. Rapidly rising usage alongside falling quality-adjusted prices is consistent with supply expanding strongly, although the data do not reveal the exact size of either shift.
Timeline
November 2022
Stanford's later AI Index data place the cost of GPT-3.5-level inference at about $20 per million tokens.
October 2024
Comparable GPT-3.5-level inference was available at about $0.07 per million tokens.
2025
Stanford documented rapid improvements in AI hardware price-performance and model efficiency.
First quarter 2026
Google's model APIs were processing approximately 16 billion tokens per minute.
Second quarter 2026
Google reported approximately 22 billion tokens per minute while Alphabet described the market as supply constrained and accelerated investment in capacity.
Using this in the exam
Use this example in a Paper 1 answer about changes in supply, price elasticity of supply (PES) or the determinants of price elasticity of demand (PED).
For supply, explain that better chips, more data-centre capacity and more efficient models reduce the cost of providing inference and increase the quantity firms can supply at each price. Draw S1 shifting right to S2. Ceteris paribus, equilibrium price falls and equilibrium quantity rises.
For PES, use the time period as the key determinant. In the short run, supply is relatively inelastic because electricity connections, data centres and advanced processors cannot be expanded quickly. Google's 2026 supply constraints and the IEA's four-to-eight-year transmission construction times provide real-world evidence. In the long run, firms can invest in new capacity, so supply becomes more elastic.
For demand, Google's rise from 16 billion to 22 billion tokens per minute is evidence of increasing usage, but it is not itself a measurement of the demand curve. Greater AI adoption shifts market demand to the right. By contrast, a fall in token prices would cause an extension of quantity demanded along an existing demand curve.
For PED, focus on substitutes. Stanford reported in 2026 that leading models from several providers had converged substantially in performance, increasing competition on price, reliability and specialization. Demand for one general-purpose API may therefore be relatively elastic when customers can switch providers. Demand may be less elastic for specialized tasks where few models provide the required quality.
Do not call this aggregate demand. Aggregate demand refers to total spending across an economy. This case concerns market demand for AI inference. Also avoid treating every AI token as identical because models differ in quality, speed and capabilities.
Syllabus topics
Diagrams to use

Test yourself
Questions this example can answer
- Explain why the supply of a good or service may be more price elastic in the long run than in the short run.
- Using a real-world example, explain factors that can cause an increase in supply.
- Using real-world examples, evaluate the factors that determine price elasticity of demand and price elasticity of supply.
Evaluation
Arguments in favour
Physical capacity constraints support relatively inelastic short-run supply
Alphabet reported strong token growth while remaining supply constrained, and the IEA identifies long delays in expanding electricity infrastructure. Producers therefore cannot immediately increase inference capacity greatly in response to higher prices.
Investment and technological progress increase long-run supply
Alphabet accelerated infrastructure investment while AI hardware and model efficiency continued to improve. These changes increase productive capacity, shift supply to the right and make quantity supplied more responsive over time.
Arguments against
AI tokens are not a perfectly homogeneous product
Models differ in reasoning ability, accuracy, speed and context length. Comparing raw token prices can therefore confuse changes in product quality with shifts of a single market supply curve.
Provider prices do not come from a perfectly competitive market
AI companies set posted API prices and differentiate their models. Market power, strategic pricing and product quality may therefore influence prices as well as changes in underlying production costs.
Context and assumptions
PED depends on how the market is defined
Demand for one provider's general-purpose API may be elastic when several similar substitutes exist. Demand for a specialized frontier model may be less elastic if suitable substitutes are limited.
Observed token usage is equilibrium quantity, not demand itself
Google's 22 billion tokens per minute reflects transactions actually processed after both demand and supply conditions have interacted. It cannot by itself identify the position or elasticity of the demand curve.
Falling quality-adjusted prices are consistent with a strong supply shift
AI usage has increased while comparable-performance inference costs have fallen sharply. This pattern is consistent with supply expanding faster than demand, but it does not prove the exact magnitude of either shift.
Key terms
- Supply
- The willingness and ability of producers to offer a good or service for sale at different prices over a given period of time.Taught in Unit 2.2: Supply
- Price elasticity of demand
- A measure of the responsiveness of quantity demanded of a good or service to a change in its price.Taught in Unit 2.5: Elasticities of Demand
- Price elasticity of supply
- A measure of the responsiveness of quantity supplied of a good or service to a change in its price.Taught in Unit 2.6: Elasticity of Supply
- Change in supply
- A shift of the entire supply curve caused by a change in a non-price determinant of supply.
- Change in demand
- A shift of the entire demand curve caused by a change in a non-price determinant of demand.
- AI inference
- The process of using a trained artificial intelligence model to process an input and generate an output.
- Token
- A unit of data processed or generated by a large language model and commonly used to measure API usage.
Sources
- 01
Alphabet Q2 2026 Earnings Call
Alphabet
- 02
Energy and AI: Executive Summary
International Energy Agency
- 03
The 2025 AI Index Report: Research and Development
Stanford Institute for Human-Centered Artificial Intelligence
- 04
The 2026 AI Index Report: Technical Performance
Stanford Institute for Human-Centered Artificial Intelligence
- 05
Gemini Developer API Pricing
Google
Related case studies
More microeconomics examples you can use in the same answer

Generative AI has expanded the supply of background music, changing market pressures and opportunities for composers and producers.

South Africa taxes vaping liquid to discourage consumption and raise revenue, illustrating how indirect taxes can address market failure.

EU countries use renewable-energy support schemes and auctions to encourage investment, increase clean-energy output and support climate goals.