Floating Exchange Rate – Market DeterminationSL
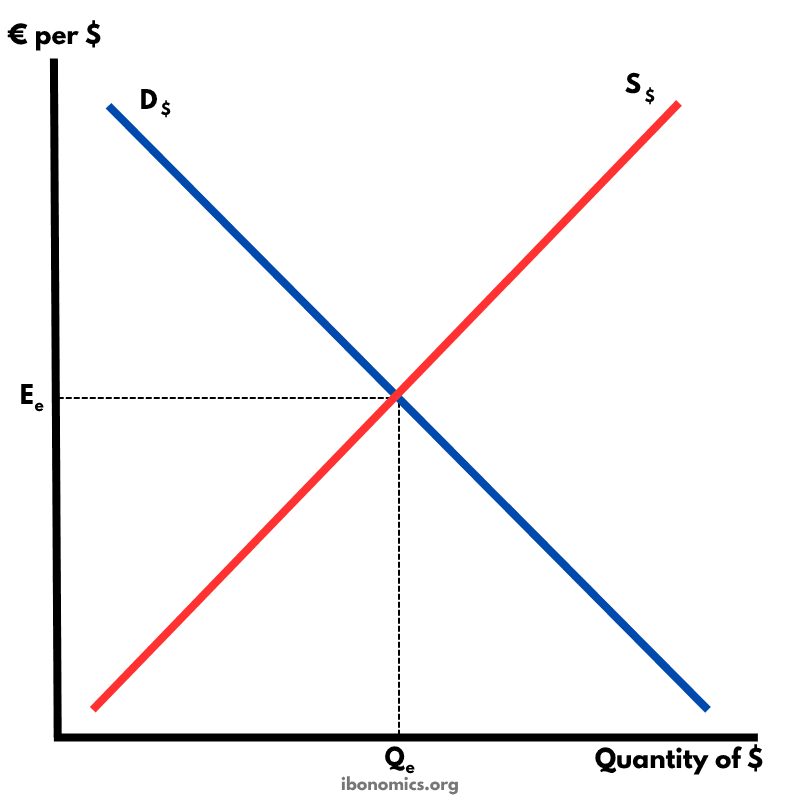
Global EconomicsThis diagram shows how the equilibrium exchange rate (Ee) and quantity of a currency (Qe) are determined by the interaction of supply and demand in a freely floating foreign-exchange market.
Curves and elements
- d
- D$: Demand for dollars, downward sloping in the foreign-exchange market.
- s
- S$: Supply of dollars, upward sloping as more dollars are offered at higher euro prices.
- ee
- Ee: Equilibrium exchange rate where D$ intersects S$.
- qe
- Qe: Equilibrium quantity of dollars traded at Ee.
Key explanations
- 1
The demand curve for dollars (D$) slopes downward because at lower euro prices per dollar, Europeans find US goods cheaper and demand more dollars to buy the US goods.
- 2
The supply curve of dollars (S$) slopes upward because at higher euro prices per dollar, US residents get more euros for each dollar exchanged and are more willing to supply dollars to buy European goods or assets.
- 3
Equilibrium occurs at the intersection of D$ and S$, establishing the market exchange rate Ee and the equilibrium quantity of dollars Qe.
- 4
If demand for dollars increases (e.g., due to higher US interest rates or stronger US exports), the D$ curve shifts right, causing the dollar to appreciate and Ee to rise.
- 5
Conversely, if supply of dollars increases (e.g., more US residents traveling abroad), S$ shifts right, leading to dollar depreciation and a lower Ee.
Example exam question
Using a foreign-exchange market diagram, explain how an increase in US interest rates affects the dollar’s exchange rate against the euro.
Show example answer
Higher US interest rates attract foreign capital, increasing the demand for dollars. The D$ curve shifts right, causing the equilibrium exchange rate to rise (dollar appreciation) and increasing the quantity of dollars traded. This appreciation continues until the higher return is offset by the stronger dollar.