IBonomics
The Current Account and the Exchange Rate – Current Account Transactions and Financial Inflows
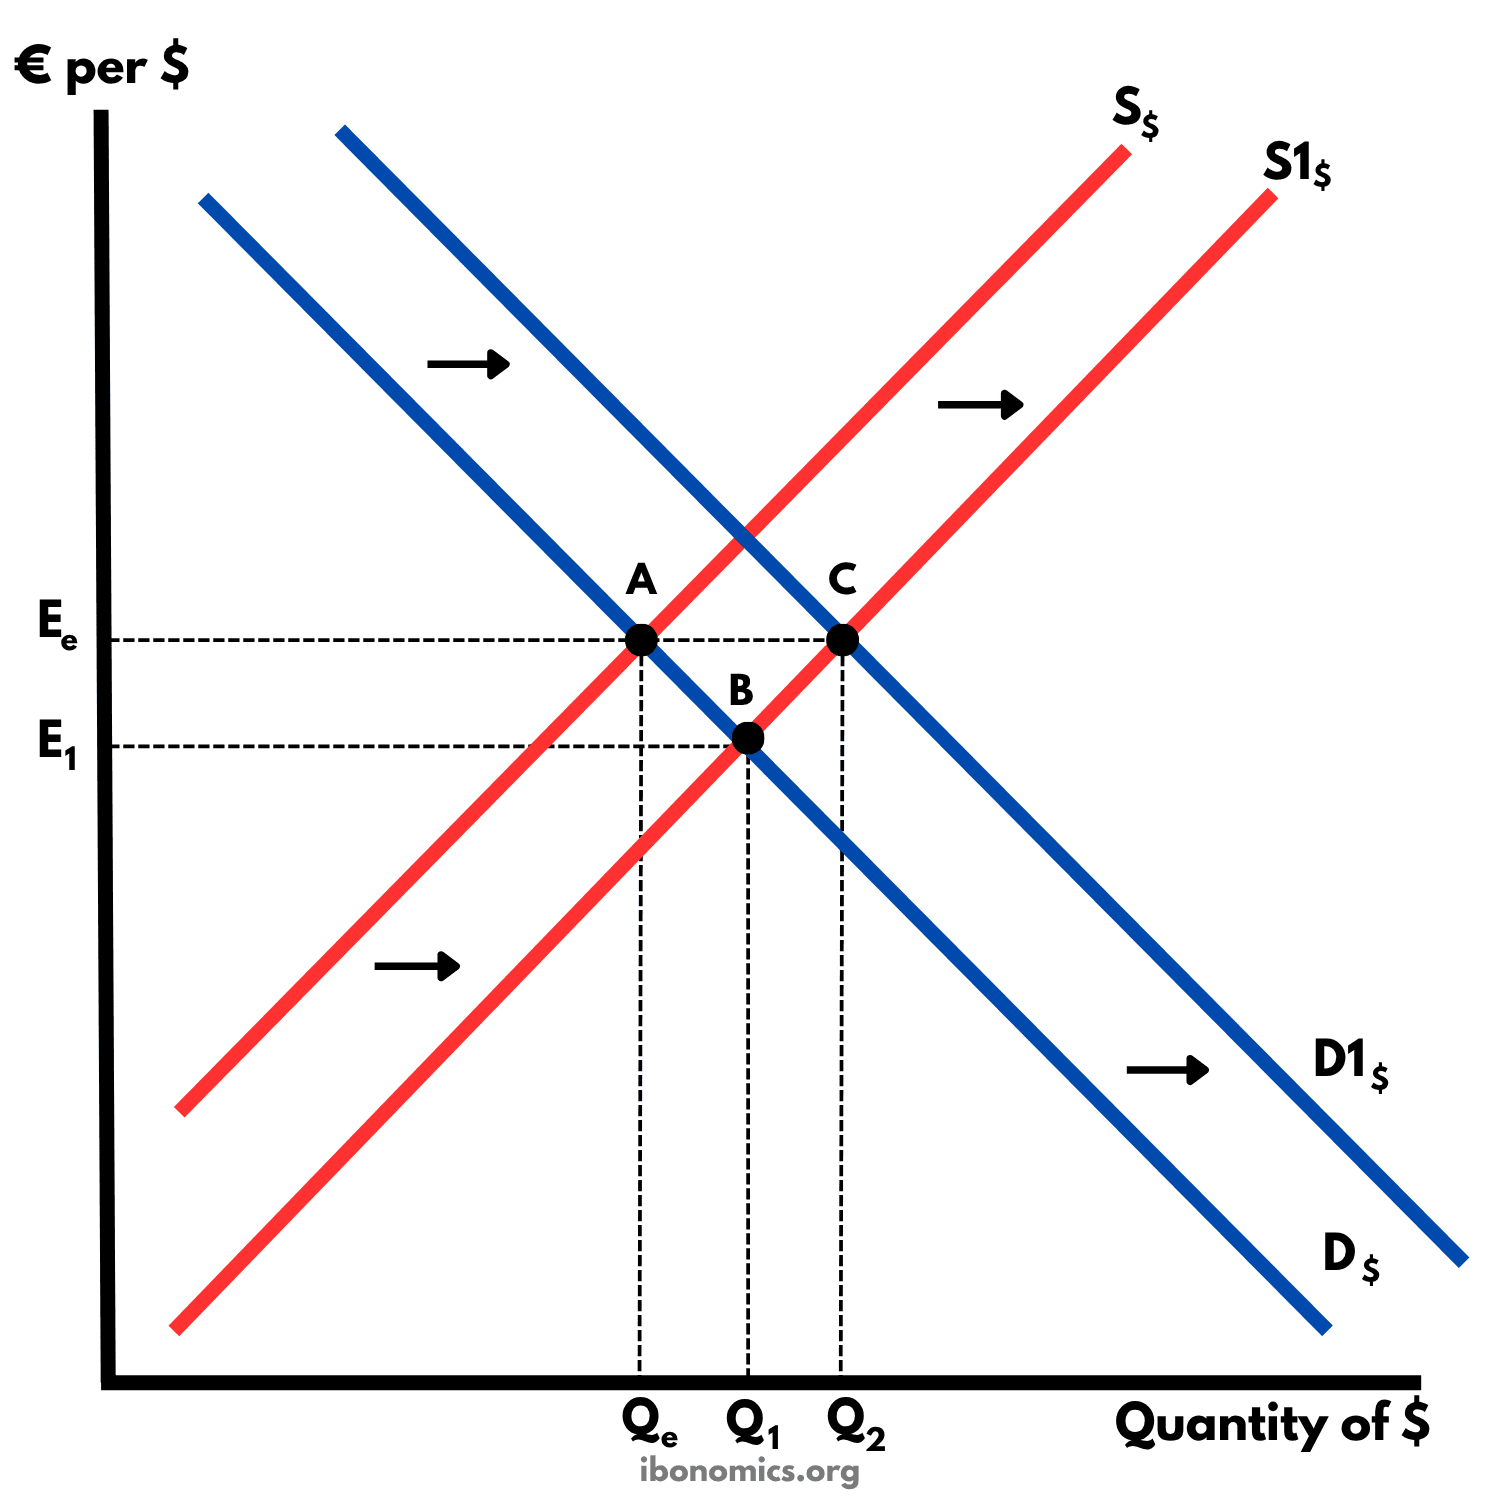
This diagram shows how current account transactions and financial inflows affect a floating exchange rate, using the market for US dollars. Higher spending on imports raises the supply of dollars and puts downward pressure on the dollar, while financial inflows raise the demand for dollars and put upward pressure on it. Where the exchange rate ends depends on the relative size of the two changes.
Curves and elements
- S$
- The supply of dollars at the start. Americans supply dollars when they pay for imports and buy foreign assets.
- S1$
- The supply of dollars after Americans spend more on imports. They sell more dollars at every exchange rate, so the curve shifts right, putting downward pressure on the dollar.
- D$
- The demand for dollars at the start, from foreigners paying for US exports and buying US assets.
- D1$
- The demand for dollars after financial inflows rise. Foreign investors need more dollars at every exchange rate, so the curve shifts right, putting upward pressure on the dollar.
- A
- The starting equilibrium, where D$ meets S$, at Ee and Qe.
- B
- Where the market would settle if only the supply of dollars rose. The exchange rate would fall to E1, with Q1 dollars traded.
- C
- The new equilibrium with both changes, where D1$ meets S1$. In the case drawn, the rise in demand matches the rise in supply, so the exchange rate is still Ee and Q2 dollars are traded.
- Ee
- The exchange rate at A, and at C in the case drawn, where the two shifts are the same size.
- E1
- The lower exchange rate at B, showing the downward pressure from higher import spending on its own.
- Qe
- The quantity of dollars traded at A.
- Q1
- The quantity of dollars traded at B.
- Q2
- The quantity of dollars traded at C, higher than Qe because both the demand for and the supply of dollars have risen.
Key explanations
- 1
The market for US dollars starts at A, where D$ meets S$, at an exchange rate of Ee euros per dollar. Americans supply dollars when they pay for foreign goods, services and assets, and foreigners demand dollars when they pay for US exports and buy US assets.
- 2
Current account transactions affect the exchange rate. When Americans spend more on imports, they sell more dollars to buy euros, so the supply of dollars shifts right from S$ to S1$. On its own, this would lower the exchange rate to E1, at B.
- 3
Higher import spending is only one source of this pressure. A fall in exports would instead reduce the demand for dollars, because foreigners would need fewer of them to pay for US goods. Either way, a weaker current account puts downward pressure on the dollar.
- 4
Financial inflows push the other way. When foreigners buy US shares, bonds, property or firms, they need dollars to pay for them, so the demand for dollars shifts right from D$ to D1$. Higher US interest rates or better investment prospects can attract these inflows.
- 5
With both changes, the market settles at C, where D1$ meets S1$. The diagram shows the case where the rise in demand matches the rise in supply, so the exchange rate stays at Ee and the quantity of dollars traded rises to Q2. If the inflows raise demand by less than imports raise supply, the dollar ends below Ee and depreciates. If they raise it by more, the dollar ends above Ee and appreciates.
- 6
A current account deficit can therefore place downward pressure on a floating exchange rate, while financial inflows can create upward pressure. The overall effect on the exchange rate depends on the relative changes in demand for and supply of the currency, so a current account deficit does not necessarily result in depreciation.
- 7
Do not confuse this with the balance of payments identity. The accounts always add up to zero, so a current account deficit is always matched by a surplus on the capital and financial accounts, once errors and omissions are included. That holds whatever happens to the exchange rate, so it does not mean the inflows prevent depreciation. The exchange rate is set by demand and supply in the currency market.
Example exam question
Using an exchange rate diagram, explain why a current account deficit does not necessarily lead to a depreciation of the currency.
Show example answer
In the market for US dollars, the exchange rate starts at Ee, where D$ meets S$. If Americans spend more on imports, they sell more dollars to buy foreign currency, so the supply of dollars shifts right from S$ to S1$. On its own, this would lower the exchange rate to E1, so a current account deficit places downward pressure on a floating exchange rate. A deficit caused by falling exports would have a similar effect, through lower demand for dollars. Financial inflows, such as foreign purchases of US shares, bonds and firms, work the other way. Foreign investors need dollars to buy these assets, so the demand for dollars shifts right from D$ to D1$, creating upward pressure. The overall effect depends on the relative changes in demand and supply. In the diagram the two shifts are the same size, so the new equilibrium at C is at the original exchange rate Ee, with more dollars traded at Q2. Smaller inflows would leave the dollar below Ee, and larger ones would take it above Ee. A current account deficit therefore does not necessarily result in depreciation.