IBonomics
Exchange Rate Depreciation – Reduced Demand and Increased Supply of Currency
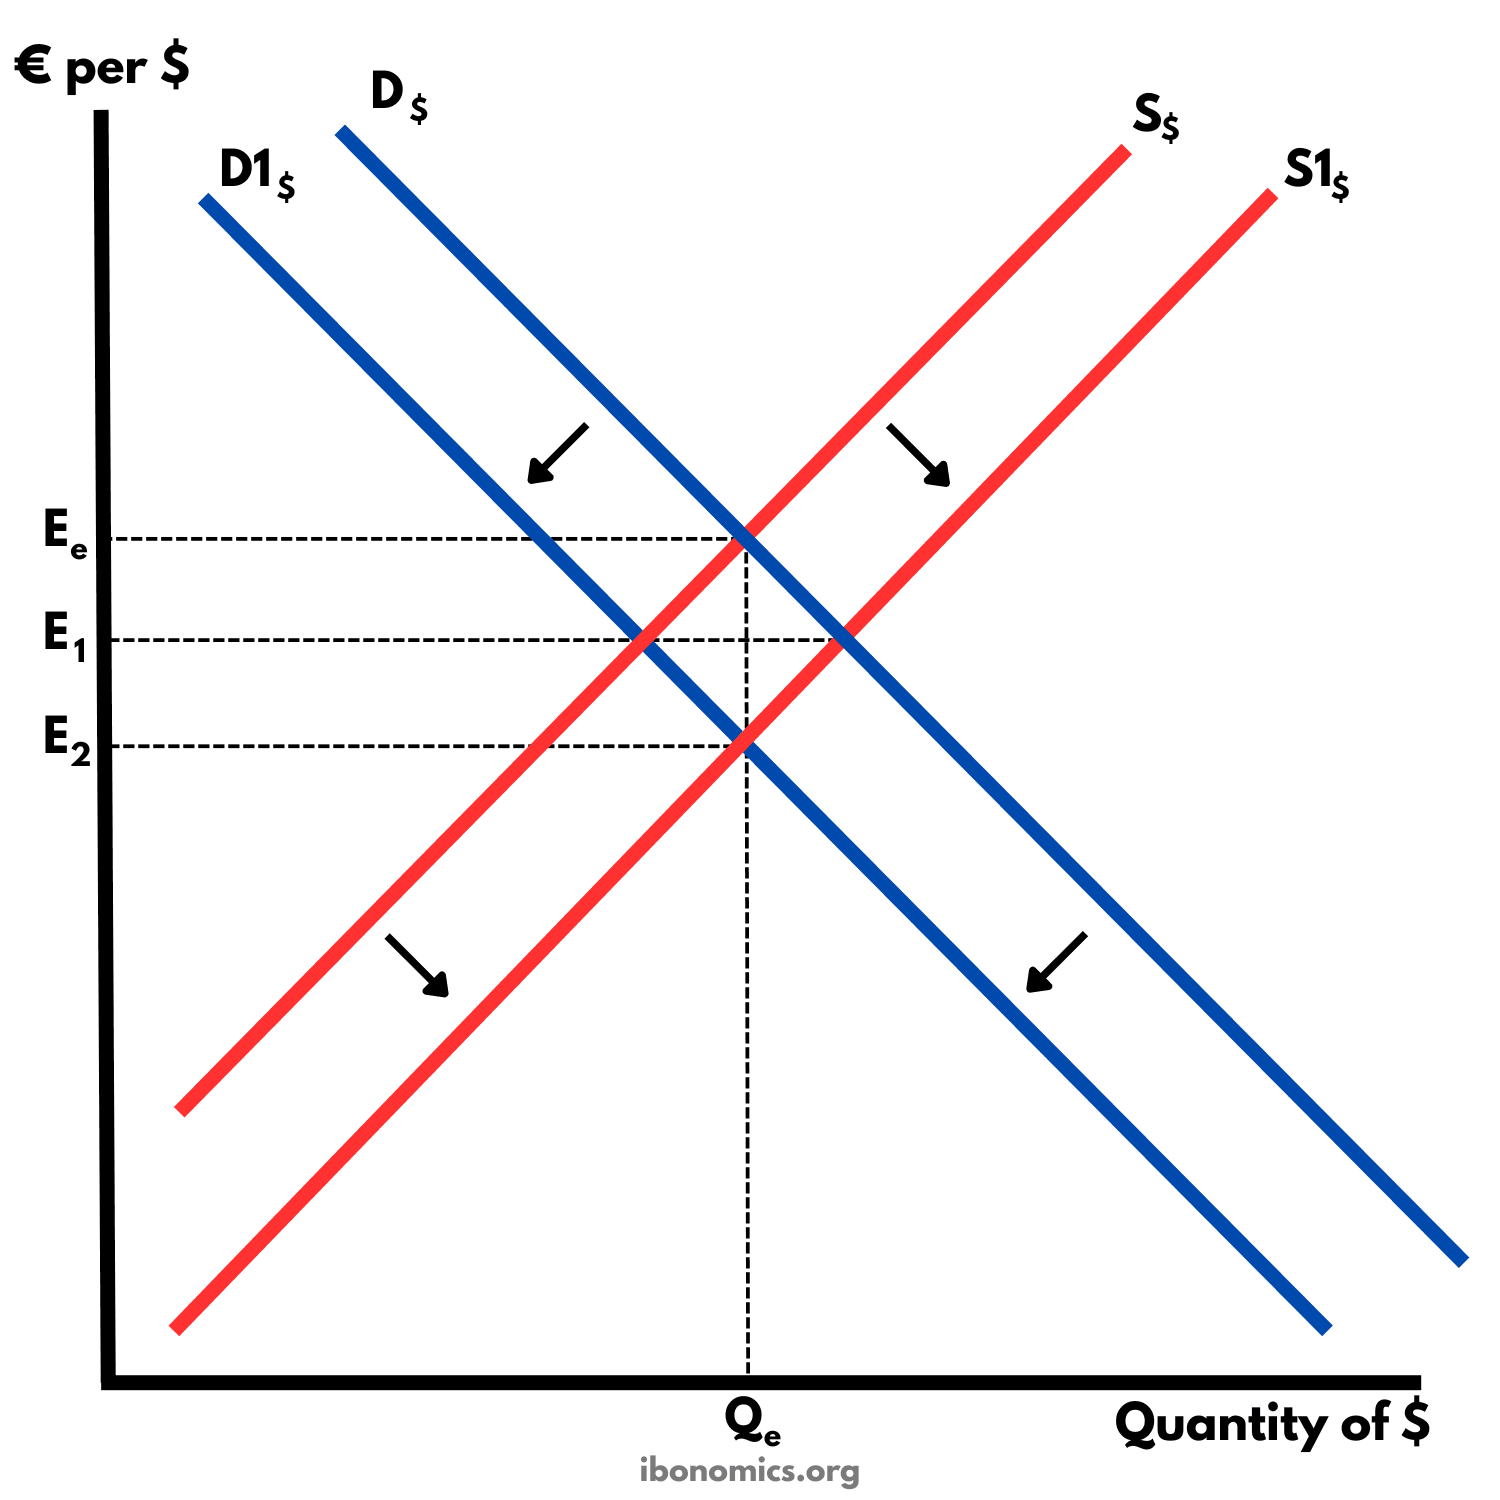
This diagram illustrates a depreciation of a currency in the foreign exchange market, the opposite of an appreciation. A depreciation occurs when the value of the currency falls because demand for it decreases and/or the supply of it increases.
Curves and elements
- D$
- The demand for the currency, which slopes downward. A leftward shift indicates lower demand at each exchange rate.
- D1$
- The demand for the currency after it falls, for example because foreigners buy fewer of the country's exports or assets, or because its interest rates fall.
- S$
- The supply of the currency, which slopes upward. A rightward shift indicates more units supplied at each exchange rate.
- S1$
- The supply of the currency after it rises, for example because residents spend more on imports, so they sell more of their currency.
- Ee
- The original equilibrium exchange rate, before the shifts in demand and supply.
- E1
- The exchange rate after either shift on its own, where D1$ meets S$ or where D$ meets S1$.
- E2
- The exchange rate after both shifts, where D1$ meets S1$, the lowest of the three.
- Qe
- The quantity of the currency traded. The two shifts are the same size in this drawing, so the quantity is the same at Ee and at E2.
Key explanations
- 1
The initial equilibrium exchange rate is Ee, where demand for the currency (D$) meets the supply of the currency (S$).
- 2
A fall in demand for the currency, shown by a leftward shift from D$ to D1$, may happen when foreigners buy fewer of the country's exports, when capital flows out, or when its interest rates fall relative to other countries.
- 3
An increase in the supply of the currency, shown by a rightward shift from S$ to S1$, may happen when residents spend more on imports or invest more abroad, so they sell more of their currency in the foreign exchange market.
- 4
Either change on its own lowers the exchange rate from Ee to E1, whether through lower demand (D1$ meeting S$) or higher supply (D$ meeting S1$). Together they lower it further still, to E2, where D1$ meets S1$.
- 5
The fall in the exchange rate from Ee to E2 is a depreciation of the currency. Because the two shifts are the same size in this drawing, the quantity of the currency traded stays at Qe.
- 6
A depreciation makes the country's exports cheaper for foreigners and its imports more expensive at home. It happens through market forces under a floating exchange rate, unlike a devaluation, which is a government decision to lower a fixed rate.
Example exam question
Using an exchange rate diagram, explain how a decrease in demand and an increase in supply can lead to a currency depreciation.
Show example answer
A depreciation occurs when demand for the currency decreases and/or supply increases. In the diagram, demand shifts left from D$ to D1$, for example because foreigners buy fewer of the country's exports, and supply shifts right from S$ to S1$, for example because residents spend more on imports. The equilibrium exchange rate falls from Ee to E2. Either shift on its own would lower it only to E1. The currency is now worth less relative to other currencies, which makes exports cheaper for foreigners and imports more expensive.